

Municipal issues in the City of Toronto are deeply affected by the results of the provincial election. Planning regulations, Ministerial Zoning Orders, transit decisions and funding, our electoral system – these are just some of the decisions about how Toronto is run that are shaped by the provincial government. So it’s worth looking at how Toronto specifically voted in the provincial election.
I’ve been fascinated by election results since I was a kid. Back then, pre-internet, the only source was the riding-by-riding results printed in the paper, which I would pore over (including checking to see how my then-favourite, the Rhinoceros Party, did).
Nowadays, with vastly more data at our fingertips, there’s a whole industry of election analysts. However, they tend to focus on the “before” – the polls – rather than the “after” – the results. When I wanted to dig into the results from Toronto in the 2018 provincial election for an electoral reform idea, I found there wasn’t any convenient list, and had to collate them myself.
So, taking advantage of that previous work, I thought it would be worthwhile analyzing the results of the 2022 provincial election specifically for Toronto’s 25 ridings, taking advantage of my previous work to provide comparisons with 2018 (see appendix at the end of this post for the full 2022 Toronto results).
Unlike 2018, 2022 wasn’t a spectacular shift election. In 2018, there was a wholesale change in representation, with the majority of seats in Toronto changing hands. In 2022, only two seats changed hands. But beneath the surface, there are some underlying shifts to dig into and think about.
In particular, the Toronto results in the 2022 provincial election highlight how Ontario’s first-past-the-post electoral system can be remarkably unrepresentative of the proportion of votes in a region. They also speak to how the different main parties have different vote patterns and potential in the city, and the way that most Toronto voters are swing voters not committed to a particular party.
Overall
While only two seats in Toronto changed hands, the number of votes for each party and their proportion of the vote changed considerably.
In 2018, while, as usual in a first-past-the-post electoral system, the number of seats won by each party was not proportional to the vote, there was at least some consistency to the pattern. The NDP got the most votes, the Progressive Conservatives were not far behind, and both won the same number of seats. The Liberals got fewer votes, and (a lot) fewer seats.
Toronto results, 2018 Ontario provincial election*
| Conservative | NDP | Liberal | Green | |
| # of votes | 360,337 | 400,847 | 287,129 | 33,354 |
| % of vote* | ~33.3% | ~37.1% | ~26.6% | ~3.1% |
| # of seats | 11/25 | 11/25 | 3/25 | 0/25 |
| % of seats | 44% | 44% | 12% | 0% |
*Note – I did not include minor party/independent results in my 2018 calculations, so all of the vote percentages are approximate and a little on the high side.
In 2022, by contrast, the disproportion is more dramatic. With much lower voter turnout, the Progressive Conservatives got fewer votes but about the same percentage of the vote, and gained a seat. The NDP got dramatically fewer votes and a notably smaller percentage of the vote, but only lost a couple of seats. The Liberals got almost as many votes as in the previous election, and increased their percentage of the vote, but only gained one seat. The Greens increased their vote and percentage, but not enough to win a seat.
In the end, the Conservatives and Liberals got almost the same number of votes. But the Conservatives got three times as many seats as the Liberals. Meanwhile, the NDP got fewer votes than either of the other parties, but managed to hold on to almost all of their seats, getting more than twice as many as the Liberals.
Toronto results, 2022 provincial election
| Conservative | NDP | Liberal | Green | Other | |
| # of votes | 274,797 | 238,600 | 271,185 | 40,903 | 25,703 |
| % of vote | 32.3% | 28% | 31.9% | 4.8% | 3% |
| # of seats | 12 | 9 | 4 | 0 | 0 |
| % of seats | 48% | 36% | 16% | 0% | 0% |
This pattern reflects the overall results in the province, where the Conservatives got fewer votes in absolute terms than in the previous election but won more seats, the NDP got far fewer votes but only lost a few seats, while the Liberals increased their percentage of the vote but got almost no additional seats.
Flipped ridings
Given the drop in their percentage of the vote, it is not surprising that the two seats that changed hands were formerly NDP.
Both seats were taken by former city councillors, suggesting that name recognition is valuable in taking a seat in an election with little overall movement. In Beaches-East York, former city councillor Mary-Margaret McMahon took the seat for the Liberals. The NDP candidate was not an incumbent, reducing the incumbency name recognition factor. As well, it’s a seat that has often been won by Liberals both federally and provincially, so the party that took over was not surprising.
Slightly more surprising was the Conservative takeover of York South-Weston, but in fact the Conservatives came a fairly close second in 2018 with a less recognized candidate. Their success in 2022 can be attributed in part to the particularly strong name recognition of the Ford family, since the Conservative candidate was former city councillor Michael Ford. It’s notable that this is not even the area he represented as a city councillor, since that area is represented in the legislature by his uncle, Premier Doug Ford. It’s clear that the Ford name is a powerful brand, at least in some parts of the city.
Another former city councillor, Kristyn Wong-Tam, held the seat of Toronto Centre for the NDP, which means that, tidily enough, there’s one former city councillor newly elected by each of the large parties.
Individual parties: Progressive Conservatives
For the first time since the current City of Toronto was created by amalgamation in 1998, the Conservatives received the most votes in the city and won the most seats. It’s a remarkable change from the years of Liberal government before 2018 when the Conservatives won no seats in the city for four consecutive elections.
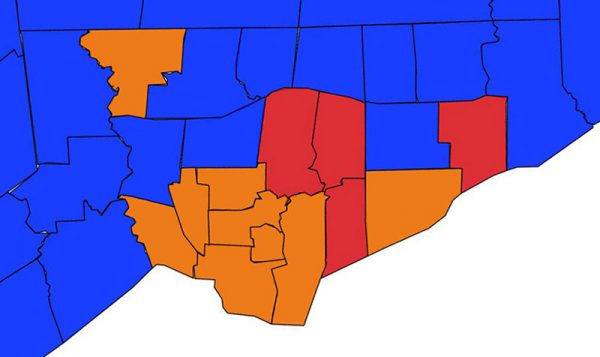
The Conservative vote is, not surprisingly, concentrated in more suburban areas rather than the old city of Toronto, but their seats extend across the city, including the furthest east as well as the furthest west.
As in the province as a whole, the absolute number of votes for the Conservatives dropped by quite a lot, but not as much as the NDP.
The Conservative percentage of the vote in Toronto remains lower than their support across the province, at 32.3% compared to 40.8% of the vote province-wide.
Individual parties: NDP
The number of NDP voters, and their proportion of the vote, decreased considerably in this election, going from the most votes overall in 2018 to the lowest number of votes of the three large parties in 2022. But the way that the NDP vote is concentrated, as well as possibly the NDP’s famed get-out-the-vote organization, enabled it to hold on to most of its seats. The NDP vote is concentrated in the old city of Toronto and in certain suburban seats.
The NDP’s support in Toronto, at 28% of the vote, was still higher than its vote overall across the province, at 23.7%
Individual parties: Liberals
The Liberals got almost as many votes this election as in the previous election, unlike the other large parties, resulting in a considerable increase in their proportion of the vote. However, it did not translate into seats because their vote was distributed fairly evenly across the city, whereas the Conservative and NDP votes were more concentrated.
The Liberals came close – within 1,000 or so votes – in several ridings. A post-election assessment in the Star suggests they suffered from not having as good a get-out-the-vote organization as the other two main parties. Had they won some of those seats (both from the Conservatives and NDP), the seat results would have ended up closer to the proportion of the votes.
Given that the Liberals got this number of votes in two elections in a row where their overall performance was very bad, and where they were deeply unpopular (2018) or when voter turnout was a record low (2022), we could perhaps think of 270,000 or so votes as the Liberal’s “core vote” in Toronto – votes they are going to get no matter what (although the exact distribution between ridings varied between these elections).
The Liberal percentage of the vote in Toronto (31.9%) was considerably higher than their overall provincial vote (23.9%), and despite being unable to translate their votes efficiently into seats, Toronto still supplied half of their limited caucus. Toronto remains a bedrock, however limited, of Liberal support in Ontario.
Individual parties: Greens
The Greens were the only party to actually increase their number of votes, and as a result their percentage of the vote increased as well.
However, they remained just under the 5% threshold that a lot of proportional representation systems use as a cut-off for representation. On the other hand, it’s possible that more voters would have cast a Green vote if they thought it would make a difference, which could have pushed them over that threshold.
The Greens were unable to come in better than fourth in any riding – the closest they came was in University-Rosedale, where star candidate, former Environmental Commissioner and deputy leader Diane Saxe came within 550 votes of the third-place Conservative, and got almost 16% of the vote. She still got less than half the number of votes of the winning NDP candidate, however.
Overall, the Greens did less well in Toronto (4.8%) than they did provincially (6%). They were noticeably weak in suburban ridings, and even came in fifth behind a fringe party in Etobicoke North.
Individual parties: fringe parties
The fringe parties – primarily the two right-wing parties, but including various other fringe parties and independents – did less well overall in Toronto (3%) than across the province (5.6%). The strongest results for the two right-wing parties were in Etobicoke, where individually or combined they got over 3% of the vote in those three ridings, and one of them beat the Greens in Etobicoke North.
They don’t appear to have made a difference in any results – there were no ridings where the Conservatives lost by less than the fringe vote.
Party potential
It’s worth looking at the breakdown of which parties contest which seats, which can reveal the potential maximum number of seats each party could conceivably win in Toronto. In most seats in Toronto, there’s a clear challenger party, with other parties out of the running.
Most seats in Toronto in 2022 were either Conservative-Liberal seats, or NDP-Liberal seats. A small number were NDP-Conservative or true 3-way races (judged somewhat arbitrarily).
While the 2022 results reflect some long-term patterns, there can be lots of differences between elections in individual ridings due to big swings or star candidates.
| Conservative-Liberal | 12 |
| NDP-Liberal | 8 |
| NDP-Conservative | 2 |
| 3-way | 3 |
This rough assessment suggests the Conservatives have a maximum of 17 of Toronto’s 25 seats they could conceivably win. The NDP would have a maximum of 13 Toronto seats they could conceivably win, although if we go back to 2018 there are additional seats (e.g. Etobicoke-Lakeshore) where they were the challenger in that election but fell behind in 2022, so they might have a chance at 15 or so seats depending on circumstances.
The Liberals, by contrast, have a maximum of 23 seats of Toronto’s 25 they could win – and in fact, they held the other two seats until 2018 and, if we look at the federal results, we can see they’re competitive in every riding in the city. This is the flip side of their inefficient vote – while it’s spread out, it also means they have potential in every riding. The NDP and Conservatives, on the other hand, have quite a few ridings – a third or more of Toronto’s seats – where it’s hard to imagine they could ever win.
Of the 4 ridings the Liberals won, one was a Liberal-NDP riding, and 3 were Liberal-Conservative ridings.
Toronto’s floating vote
A key message from the massive turnover in the 2018 election, and the comparison of the federal and provincial elections (which use identical riding boundaries), is that there are no safe seats in Toronto. Even the four ridings the Liberals won in 2022 were won by fairly small margins. The NDP ran up very large margins in some of their seats – but these are seats won by Liberal candidates federally in 2021, by fairly comfortable margins with the exception of Davenport. While some of the Conservative wins were comfortable, none of their margins were massive.
While each party has a core of support, the majority of Toronto voters are swing voters. They are mostly divided between Conservative-Liberal swing voters in the suburbs, and NDP-Liberal swing voters in the older part of the city, but there are plenty of ridings where voters seem willing to consider three or more parties, depending on the situation. Toronto as a whole is a 3-way race, and no party can count on Toronto seats.
This situation is healthy – it is as it should be in a democracy. Within Toronto, no party can rest on its laurels, or not worry about the appeal of its candidates. Toronto voters keep Ontario’s political parties on their toes. While the suburban Greater Toronto Area just outside the City of Toronto is often seen as the decisive voting area that decides Ontario (and even national) elections, Toronto itself is also a powerful force in deciding who wins, and who becomes the opposition.
Electoral reform scenario
I originally tabulated the 2018 election results in Toronto to test an electoral reform idea I call the “wildcard” system (full details in this Medium post). The idea is to assign extra representatives to parties that are under-represented in a region (much like some proportional representation systems). But the difference is that those additional representatives are chosen from the best-performing losing candidates of that party in the region (somewhat like how in sports, some teams might get a wildcard berth into the playoffs based on their record even if they are behind other teams in their division).
The idea is that 1) voters don’t have to do anything different from what they do now (vote for one candidate in their own riding), and 2) all representatives have gone through the electoral process and been voted for directly by voters.
It’s based in part on the fact that in many cases, losing candidates in one riding got more actual votes than winning candidates in neighbouring ridings.
The proposal is to assign 5 more seats in a 25-seat region such as Toronto. In 2018, the breakdown (see the appendix at the end) led to four additional Liberals and one additional New Democrat.
In 2022, by contrast, the much bigger divergence between the Liberal vote and the Liberal seat count means that all 5 compensating seats would go to the Liberals.
Unlike in 2018, where the end result was quite close to proportional, the result now would not be as close to proportional – but it would still be much closer than before.
Results with 5 additional seats assigned proportionally
| Conservative | NDP | Liberal | Green | |
| % of vote | 32.3% | 28% | 31.9% | 4.8% |
| Total seats | 12/30 | 9/30 | 9/30 | 0/30 |
| % of seats | 40% | 30% | 30% | 0% |
If the Greens had reached the 5% threshold, they might have been eligible for a seat. However, when it came to the last seat, the Liberals at 8/30 seats would be at 26.7% of the seats – still 5.2 percentage points lower than their vote percentage, compared to 5 percentage points for the Greens, so the Liberals would still edge out that last seat. (Had the Greens qualified for a seat, it would have gone to Diane Saxe in University-Rosedale, the Green with the most votes and who also passed a 15% riding vote threshold).
The “lucky loser” Liberal candidates who got the most votes would be from the following ridings, with their number of votes:
Losing Liberal candidates with the most votes
| Riding | Votes |
| Etobicoke—Lakeshore | 17,163 |
| Eglinton—Lawrence | 16,083 |
| Etobicoke Centre | 15,403 |
| Toronto—St. Paul’s | 14,200 |
| Toronto Centre | 12,816 |
Remarkably, the top four of these candidates got more votes than Premier Doug Ford did in winning Etobicoke North (13,845)!
The top two of these candidates got more votes than any of the winning Liberals in Toronto.
There were six winning candidates in Toronto who got fewer votes than any of these lucky losers.
It’s worth noting that, back in the day when the Liberals dominated most of the seats in Toronto, the Conservatives and NDP would have been the parties benefiting from this system.
Appendix: Toronto results in Ontario’s 2022 provincial election
Note – these numbers are based on the preliminary results. The final results may be different by a few votes in some cases.
| Riding | PC | NDP | Liberal | Green | Other |
| Beaches—East York | 7,536 | 13,500 | 14,398 | 4,154 | 1,060 |
| Davenport | 4,994 | 20,242 | 6,815 | 1,710 | 918 |
| Don Valley East | 8,998 | 4,355 | 12,313 | 1,139 | 1,231 |
| Don Valley North | 15,121 | 3,113 | 11,703 | 1,179 | 690 |
| Don Valley West | 13,985 | 3,322 | 15,849 | 1,196 | 947 |
| Eglinton—Lawrence | 16,805 | 3,801 | 16,083 | 1,512 | 1,258 |
| Etobicoke Centre | 21,999 | 3,886 | 15,403 | 2,033 | 1,931 |
| Etobicoke—Lakeshore | 17,966 | 8,595 | 17,163 | 2,277 | 1,979 |
| Etobicoke North | 13,845 | 3,288 | 5,885 | 690 | 1,307 |
| Humber River—Black Creek | 6,219 | 7,100 | 6,232 | 388 | 678 |
| Parkdale—High Park | 6,270 | 23,024 | 9,547 | 2,587 | 1,236 |
| Scarborough—Agincourt | 14,040 | 2,482 | 10,672 | 628 | 784 |
| Scarborough Centre | 11,472 | 8,344 | 9,688 | 902 | 1,470 |
| Scarborough—Guildwood | 8,484 | 4,523 | 12,271 | 745 | 738 |
| Scarborough North | 12,646 | 4,740 | 7,750 | 479 | 482 |
| Scarborough—Rouge Park | 15,732 | 7,576 | 9,522 | 835 | 937 |
| Scarborough Southwest | 9,436 | 15,954 | 6,356 | 1,223 | 909 |
| Spadina—Fort York | 6,211 | 15,595 | 9,463 | 1,904 | 676 |
| Toronto Centre | 4,245 | 15,277 | 12,816 | 1,784 | 787 |
| Toronto—Danforth | 5,556 | 22,890 | 9,240 | 2,513 | 1,126 |
| Toronto—St. Paul’s | 9,445 | 15,292 | 14,200 | 2,302 | 936 |
| University—Rosedale | 6,642 | 14,447 | 10,411 | 6,092 | 622 |
| Willowdale | 13,137 | 2,977 | 11,050 | 1,062 | 673 |
| York Centre | 12,875 | 3,935 | 8,984 | 799 | 1,523 |
| York South—Weston | 11,138 | 10,342 | 7,371 | 770 | 805 |
| TOTAL | 274,797 | 238,600 | 271,185 | 40,903 | 25,703 |
| % of vote | 32.3% | 28% | 31.9% | 4.8% | 3% |
| % of seats | 48% | 36% | 16% | 0% | 0% |
| # of seats | 12 | 9 | 4 | 0 | 0 |
A couple of typos corrected after publication thanks to reader William.
4 comments
At least provincially, not quite true about Beaches-East York having been “often” won by the Liberals–in fact, Arthur Potts winning it for the OLP in ’14 broke a decades-long stranglehold by the ONDP…
Thanks for this, not fully digested. Many are upset that Mr. Ford and his party now have 100% of the power but with only about 20% of eligible Ontarians voting for him, as there was near-record-low turnout. So was this low turn-out throughout Ontario? Did some ridings/areas do better than others? Is there any mapping of this turn-out compared to the results? Cities especially are going to be hit again; maybe if Ms. Horwath does run for Hamilton Mayor there will be some mid-election meddling because Mr. Ford got away with it in Toronto, and the only prevention is the federal disallowance, but they’re not interested in defending democracy, at least within Canada.
Want to change voters’ attitudes about voting?
Want to solve “splitting the vote”?
Let voters mark as many options on their ballot as they like.
It’s just that simple.
One single change — removing the rule where a ballot with multiple marks is disqualified as “spoiled” — could make all the difference in the world.
There’s no need to consider any of the sexy-sounding but ultimately complicated schemes being touted these days, like Proportional Representation or Mixed Member Proportional or even One Potato Two Potato. There’s no need to rewrite how a government is assembled. All those schemes are focusing on the wrong end of the problem.
Basically, stop forcing voters into a corner; stop restricting them to just one single precious mark on their ballot.
The ballot would not have to be redesigned.
The counting of votes would still be extremely simple.
The winner would still be the candidate with the most votes.
[ “Approval Voting” described in under a minute: https://www.youtube.com/shorts/L1V8Vh-F2no ]
Benefits:
– Voters need no longer consider “strategic voting” to try to block choices that they fear.
– If voters no longer feel as if they’re being backed into a corner, then they might be more willing to actually go out and vote.
– Political parties need no longer consider merging/uniting into “big tents” since the voters would be free to choose as many of the available “tents” (big or small) — or as many of the independent candidates — as they like.
– Voters’ intentions would be clearer because of the added data of their alternate choices. That new data could mean less guesswork for the parties and for the pollsters.
– Approval voting can work for elections to any level of government, to elect candidates with or without party affiliations.
https://en.wikipedia.org/wiki/Approval_voting
Party leaders are selected using a preferential ballot system NOT First Past The Pos. However it’s somehow abhorrent to Doug Ford that we could use it for municipal or provincial elections.