
Since publishing my first EcoDensity article (that was subsequently posted on The Tyee), this map seems to have reached all corners of the Vancouver. Given the latter, I’ve been asked a number of questions about it and, thus, I think that it requires some explanation and reflection.
The Specs
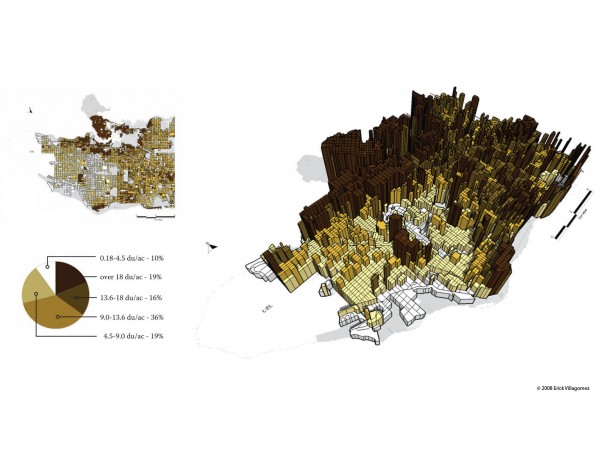
The map was created from Census 2006 data that quantified the gross population density of Vancouver by the block – one of the most interesting census maps that I had encountered. The information was given originally in number of people per hectare (by block), which I then converted to dwelling units per acre (du/ac) – using the 2006 Census average of 2.2 people per dwelling.
Why convert? Well, being a part of the industry, dwelling units per acre is the most common way to discuss density. This can then readily be related to building types – i.e. single-family neighbourhoods are typically between 0.25 – 4 du/ac gross. This could then be weighed against other meaningful standards such at typical “sustainable” densities, etc. Given that I was targeting policy-makers and CoV industry professionals with the article, I thought this standard would be the most fruitful and information.
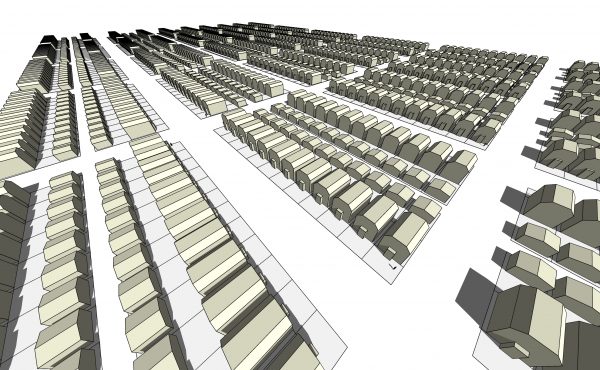
The professionals at www.realspace3d.com/residential-rendering then took this information and it was transferred to a 3-d rendering software and extruded in accordance with the converted values. A plan and pie chart giving the viewer a more information was then included – adding to the 3-d snapshot.
Reflections
After hearing much commentary, I beleive that its success and popularity lay in its accessibility – beyond the jargon-based details stated above. For it graphically expressed a simple and fundamental question that EcoDensity documentation failed to address: where does the density currently exist and how is it distributed throughout the city.
As it is explicitly depicted – and as the article describes – the vast majority of the density currently lies within Vancouver’s Eastside. Anyone familiar with CoV planning documentation would have guessed this outcome since there are a number of laws that make densifying low-density Westside neighbourhoods quite difficult. But the extent of this difference is somewhat surprising.
That said, I think one of the more interesting aspects of the graphic is a subtle one. Anybody familiar with the Eastside communities knows that they look like run-of-the-mill single-family neighbourhoods. But, as this map shows, this is very different to the reality of the situation. Within each freestanding house live many more people than one would expect. This is a mixed blessing, of course. My humble 1100sq.ft, three bedroom half-duplex used to house 5 single, unrelated occupants living in separate rooms, prior to my family moving in.
Surprising? Yes. Disturbing? Perhaps. But, nonetheless, it shows our ability to adapt these environments to accommodate ours needs, and how the lack of affordable homes has affected the behaviour of this city’s inhabitants despite municipal attempts at control. Not to mention how these densities can create vibrant communities.
At the end of the day, however, I think that Vancouver – or, at least the Eastside – is truly deserving of its reputation as an urban suburb.
***