

Our housing crisis is fundamentally a rental crisis. As such, it’s important to keep the numbers straight so that we can better focus our energy and resources. Following up on a previous blog post I wrote on rents and vacancy rates, there is another misleading rental stat originating from City of Vancouver’s Housing Strategy that has been making the rounds on social media.
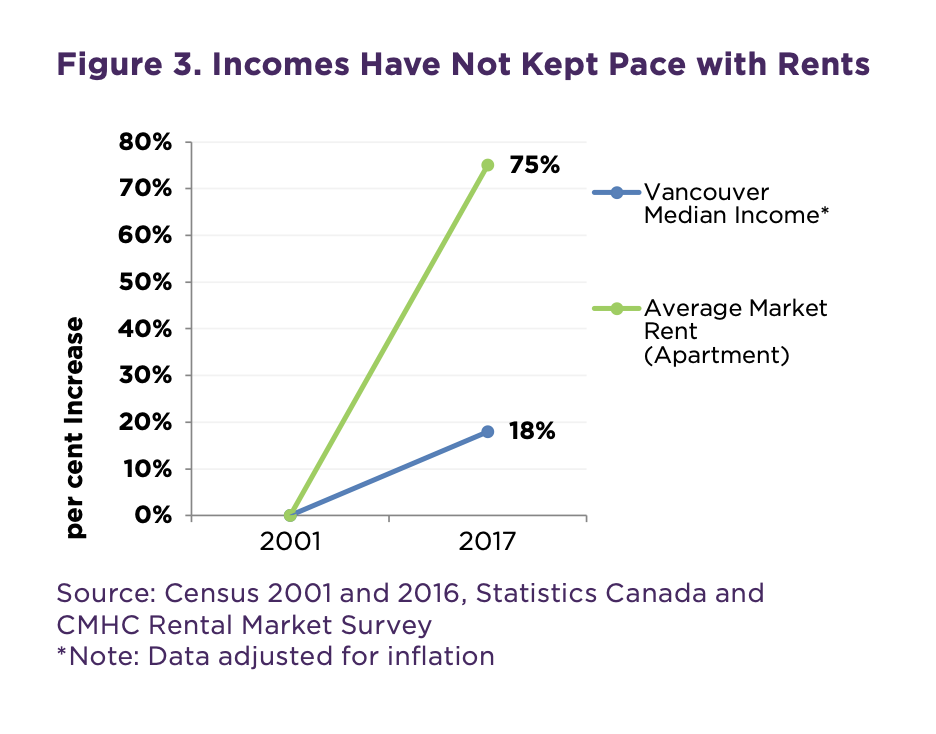
The graphs purports to show that average rent increased by 75% while median income increased only by 18%. It originates from page 14 of the Housing Vancouver Strategy, but it comes with the caveat that the income change has been adjusted for inflation, while the rent increase is reported as nominal. The graph is misleading since most people won’t understand the fine print and assume the rent change and income change numbers are directly comparable. This is not the case. A better way to graph the data is to either adjust both income and rents, or none.
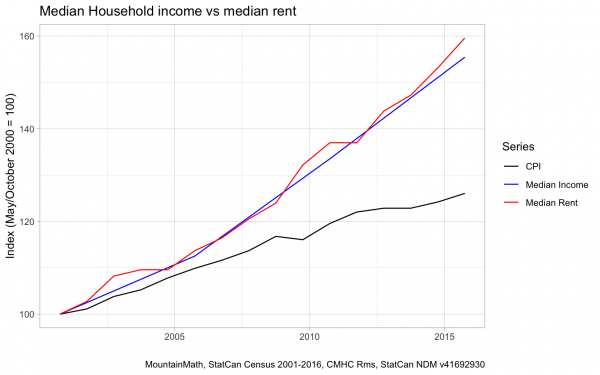
There are some other issues, too. The choice of time frame is odd, for example. The information is using census data, which only has incomes for 2000, 2005, 2010, and 2015, but reports that these were based on where people live in the respective year after (the census years). Using the Canada Revenue Agency T1 information that is available on an annual basis is a better choice—something we will see a little later. For now, let’s just see what happens when we follow the Housing Vancouver Strategy and use census income numbers.
It also makes more sense to use median rents instead of averages. Interestingly, median rents increased more than average rents. Separating out bedroom types is not that important when looking at the rent change index, although three or more bedroom rents rose noticeably slower than the rest.
Another choice is how to adjust for inflation. Using the Metro Vancouver consumer price index makes of the most sense, although other choices, e.g. the national CPI, will only change the absolute value of the index and not the relationship between the rent and income index.
Lastly, the document is not clear on what income are being used in the graph. It talks about “local incomes”, which is unhelpful in understanding the definition used. We are hypothesizing that the report used household income, as other parts of the report mentioned household income and households relate directly to dwelling units.
Let’s see how changing these variables transform the graph:
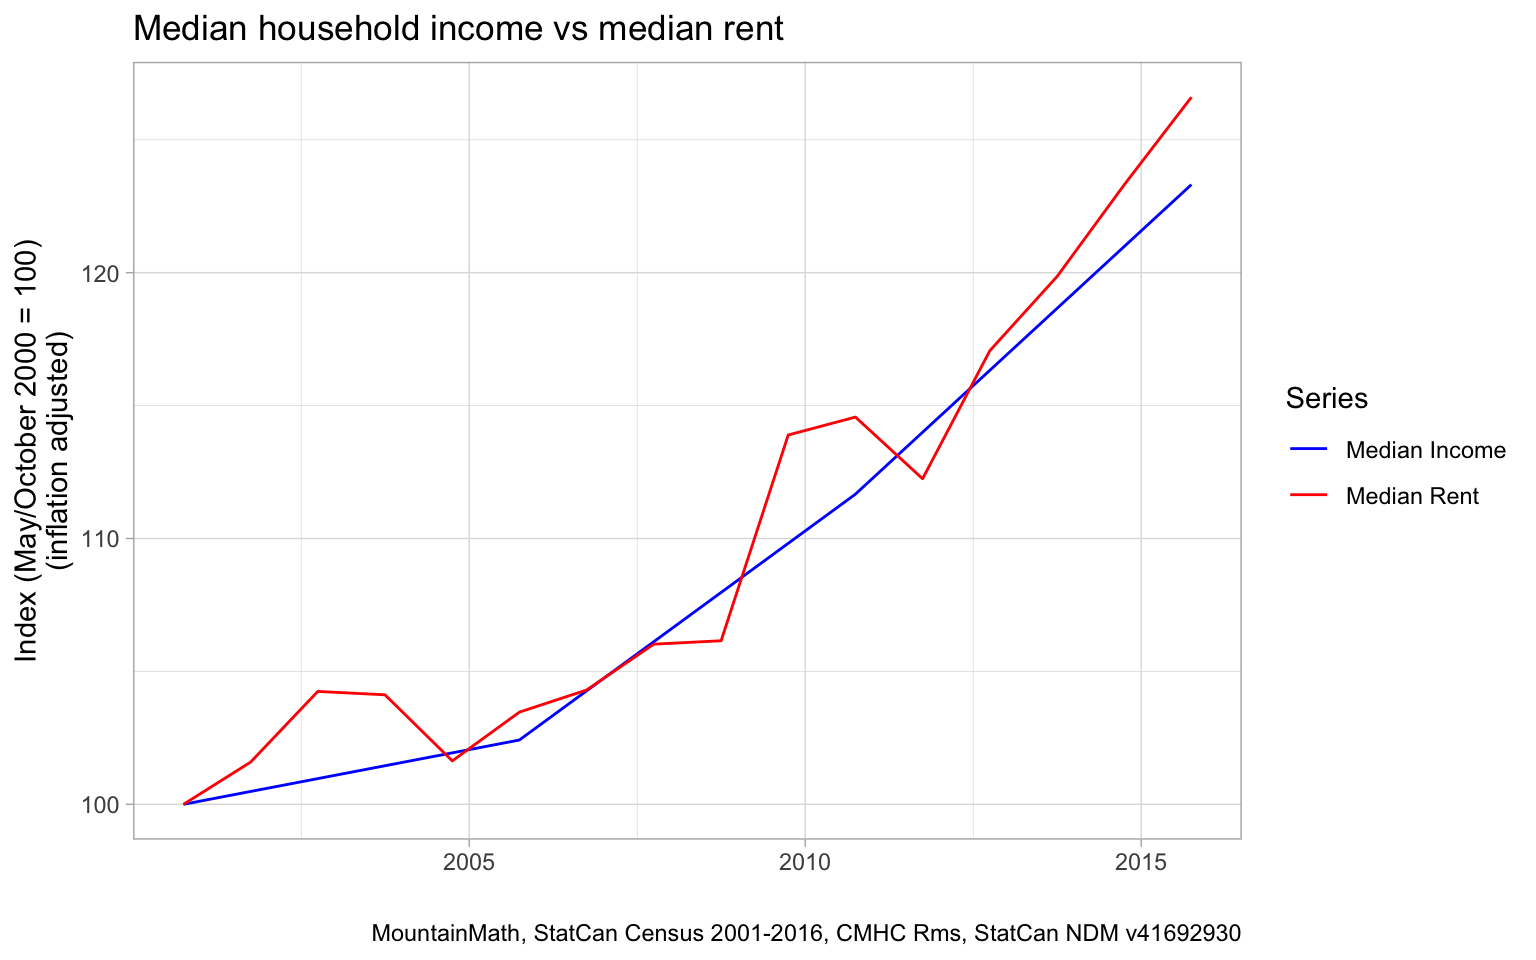
Clearly, median rents and median household incomes in the City of Vancouver have both risen roughly in unison, with rents slightly outpacing incomes.
It is worthwhile to separate changes by bedroom type.
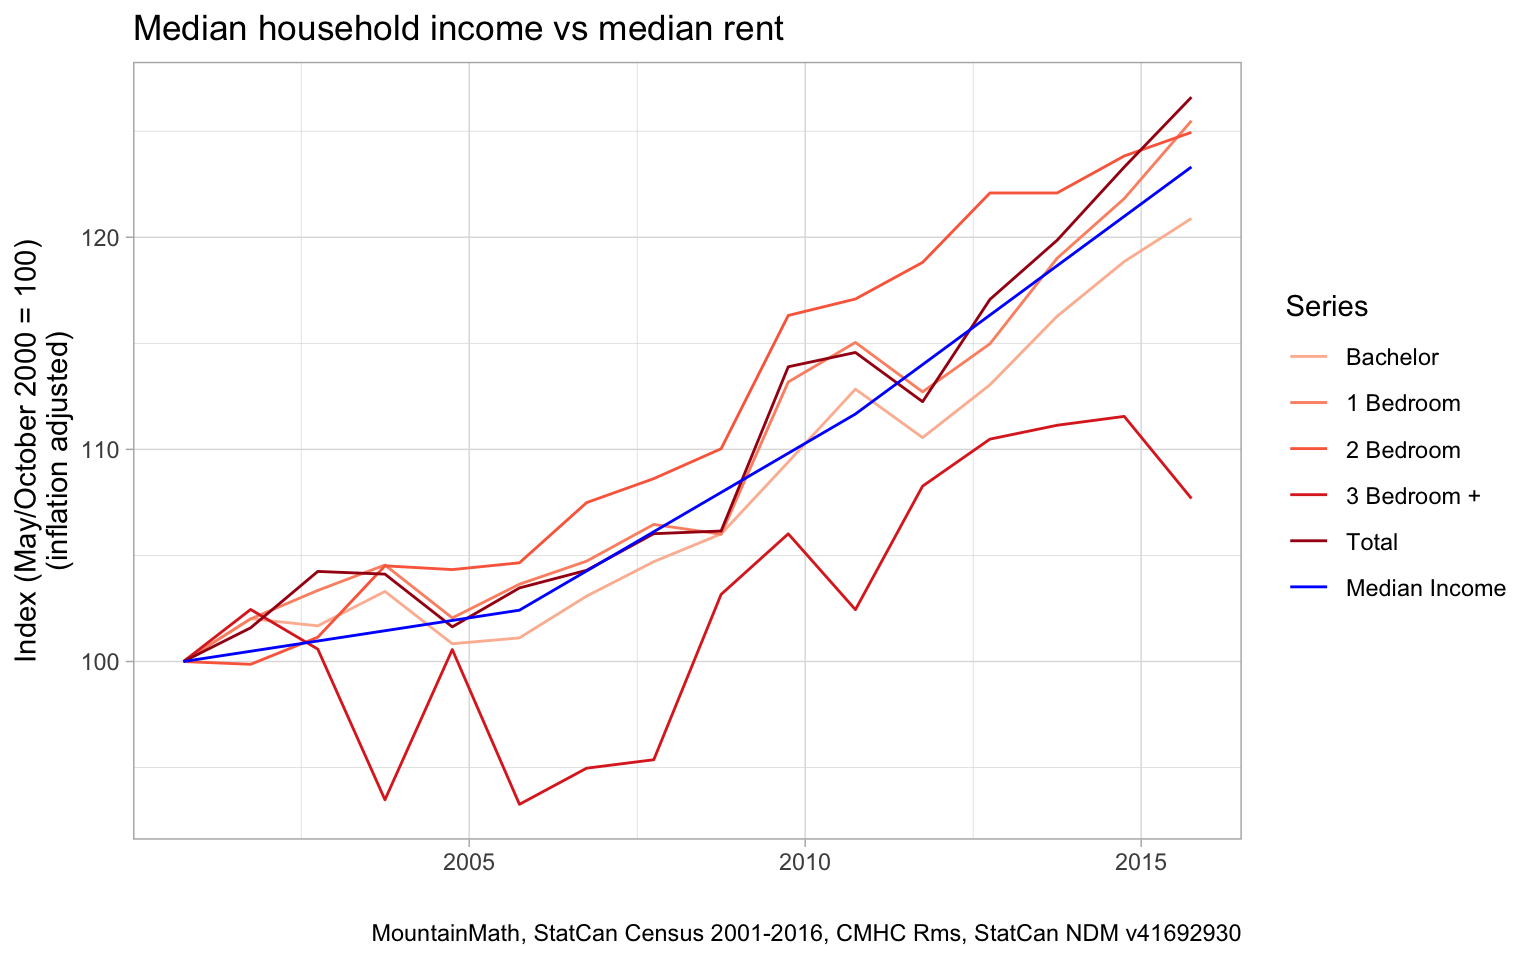
Note that real rents for three or more bedrooms homes did decrease at times, although the small sample size tells us we should not put too much weight into this. Moreover, the Total rent was higher than any of the individual rents in 2015, which points to a change in composition, probably driven by a mixture of location effects as well as the City of Vancouver’s requirements for 2 and 3 bedroom units, which generally fetch higher rents. This, in turn, has an impact on the unit mix, pulling up the total rent change.
Given that census data is only available every five years, using the latter for incomes makes it hard to track the relationship between rents and incomes in a timely manner. Rather than relying on census data for incomes, we can also measure changes in incomes using the annual Canada Revenue Agency T1 taxfiler data for census families and unattached individuals. Alternatively, we could use income of economic families. Currently, this information is not readily available at the city level, but this will likely change in the near future. For now, let’s investigate changes in rents and incomes at the Metro level.
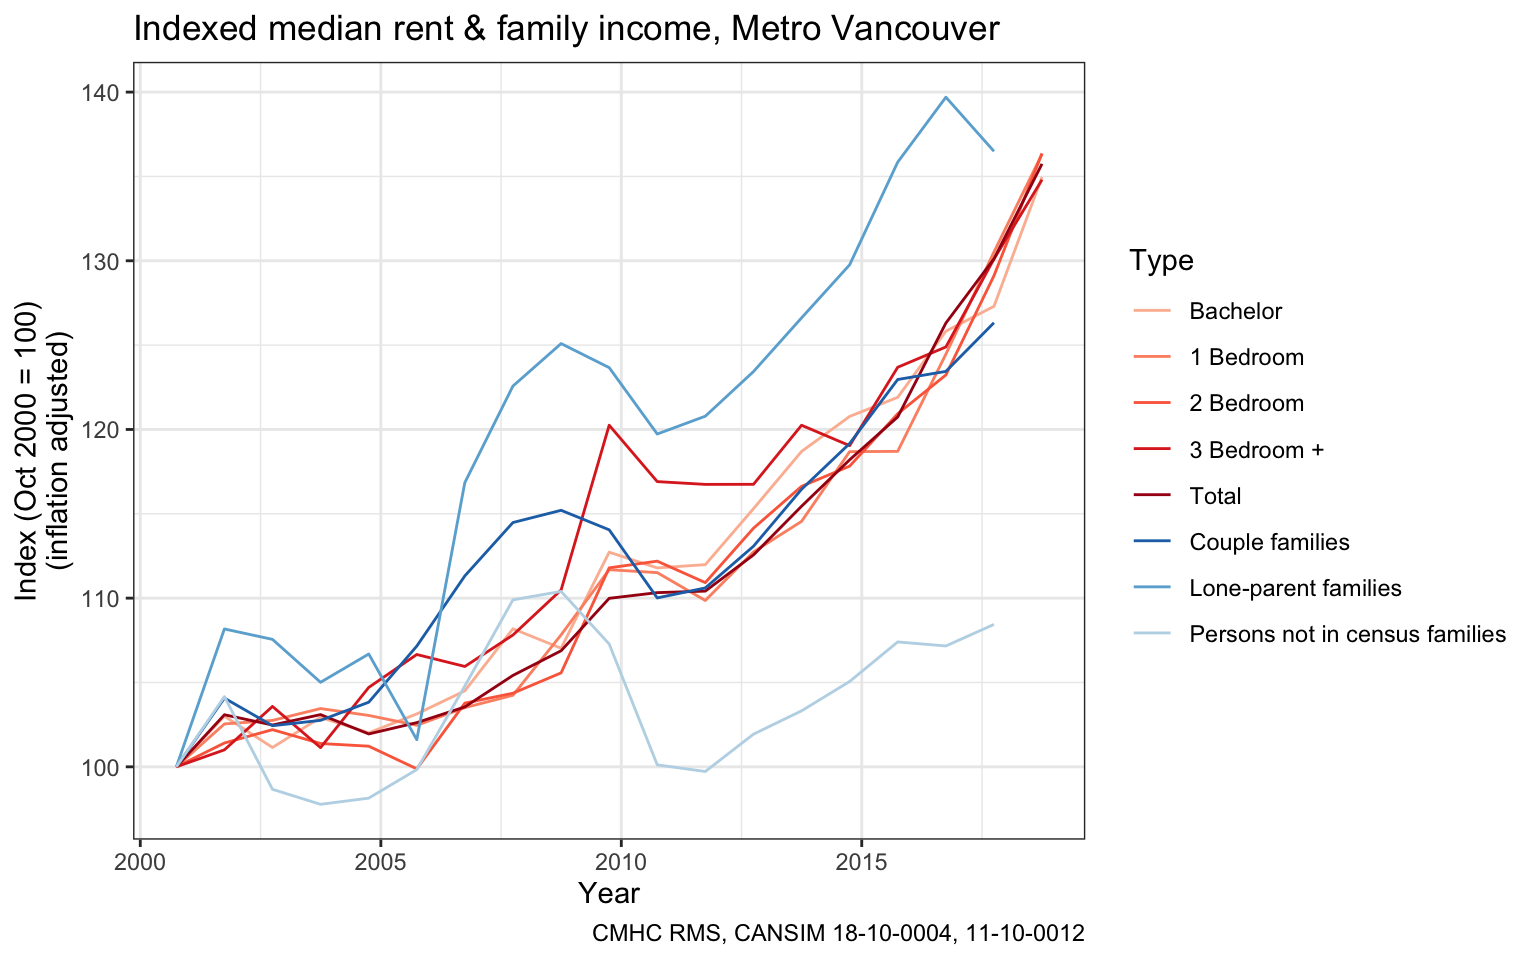
Although the graph is a bit messy, it paints a very similar picture to the previous ones, insofar that incomes of Couple families track quite well with rents. The same can’t be said for Persons not in census families. It’s worthwhile to investigate this further.
The Persons not in census families category contains a range of subgroups that don’t expect to see changes in income, including students. This will naturally pull down changes in median income. This demographic also doesn’t map well to households, especially in Vancouver with their high share of complex households, which makes it difficult to directly compare their relationship to rents with that of census families. We, again, notice the volatility in the three or more bedroom rent estimates, which is less robust due to the relatively low number of such units.
Note how the T1 taxfiler data lags the rent data—as tax declarations always lag one year—with further processing by the Canada Revenue Agency and Statistics Canada delaying the release of the data even further.
Ultimately, the above offers a stark contrast with the information presented within Housing Vancouver Strategy that is finding social media traction. Median rents have tracked median household incomes quite well across Vancouver. Similarly, Metro Vancouver median rents have tracked median family incomes.
This, on its own, doesn’t mean that all is well in the rental market. With our anemic vacancy rates, this is likely the result of sorting by income, with lower-income people getting pushed out and higher-income people staying. We have noticed clear signs of exactly this sorting by income happening in the City of Vancouver. Renters are also facing a loss in mobility, with turnover rents being significantly higher than (rent controlled) stock rents.
Another point of caution is that we looked at overall income changes, not specifically at income for renters only. It might be worthwhile to dig into this further, looking into full income and rent distributions, and also split off-market rentals from subsidized rentals while treating student households separately. This, however, would require a custom tabulation and is beyond the scope of this piece. From other data we know that shares of renter households with shelter-cost-to-income above the 30% or 50% thresholds have not changed much or even decreased over the time period, indicating that this may not yield different results.
Rents tracking income changes also means that things have not improved. Renters have been struggling for a long time with high rents and a larger-than-comfortable share of their income going toward shelter costs.
At the end of the day, digging deeper into the data helps us to better understand the issues renters are struggling with. And instead of casting this as an issue of “local incomes” diverging from rents—which is not the case, as we have seen—we should focus on reducing the sorting pressure by creating more homes for renters. Below-market rentals will be most effective in this, and we should mobilize all the federal, provincial and local resources we can get to make that happen.
That said, adding housing in general—which has mostly been market housing—has also generally helped low-income populations to maintain or even grow their size. This points to the fact that a well-considered, varied approach to housing is required to solve our affordability woes…one that shies away from painting inaccurate pictures of the problem and channels meaningful information towards focusing our attention where it’s needed.
***
For further reading on affordability and data analysis read—Understanding Affordability: A Partial Picture.
**
The code for this post is available on GitHub for anyone to reproduce and adapt for their own purposes.
*
Jens von Bergmann holds undergraduate degrees in Physics and Computer Sciences and a PhD in Mathematics. He taught for several years at the University of Calgary, University of Notre Dame and Michigan State University before founding MountainMath to work on his passion for data analysis and visualization.

One comment
While you rightly to suggest “housing crisis is fundamentally a rental crisis”, you neglect to measure how unaffordable this housing is becoming in terms of the income of the households actually struggling to afford it!
The fact that median income for ALL households inflated at a similar pace to median rents is cold comfort for RENTER households — a group which tends to have much lower incomes, and lower levels of income growth.
I appreciate the thoughtful rigour of this piece, but in brushing aside the glaring difference between “overall income changes” and “changes for renters” as a “point of caution…beyond the scope of this piece”, this piece misses the forest for the trees.
The Housing Needs Analysis recently (May, 2019) published by Toronto City Staff doesn’t neglect this important difference. (https://www.toronto.ca/wp-content/uploads/2019/05/981d-IZ-Assessment-Report-Need-and-Demand-formatted-170519-accessiblePAC.pdf). It shows that renter household have just under HALF the median income of owner households ($45k / year vs $92k / year) in Toronto, and considers rental housing affordability in relation to the incomes available to each decile of renter households. A stark picture is offered of how unaffordable a growing proportion of the units in the city are becoming to the poorer half of Toronto’s renters.
Until our approach to measuring affordability firmly pinpoints the extent to which a range of renter households are losing access to units of housing they can afford, governments will continue to get away with loosely defining the “affordable housing” their programs subsidize, producing rental housing most renters can’t afford (such as Toronto’s definition — housing that is affordable to people paying 100% of the Average Market Rent (which is unaffordable to 45% of Toronto’s renter households); or the definition used by the Liberal’s new $14 billion Rental Construction Financing Initiative — housing that rents at 30% of median income for all families in the area (which is unaffordable to 3/4 of renter households in Toronto!))