
Live in Vancouver? Then you’ve seen those annual rankings that celebrate it as one of the world’s “most livable cities.”
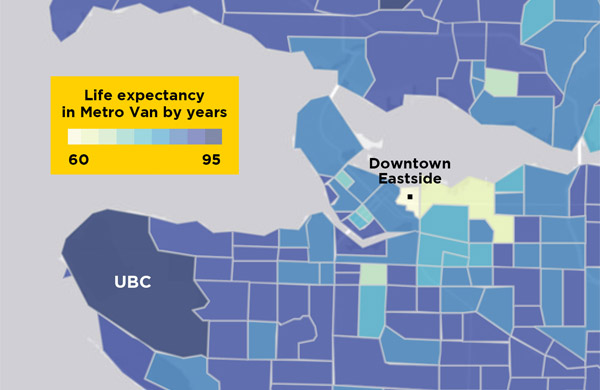
But zoom in to the neighbourhood level — what Statistics Canada calls “census tracts” — and you’ll see that life expectancy can vary by as much as 30 years.
The area with the lowest life expectancy is the Downtown Eastside, where the average resident is expected to live 60.2 years.
The area with the highest life expectancy is the University Endowment Lands, where the average resident is expected to live 90.4 years.
Metro Vancouver residents all understand inequality when it comes to housing in the region, but a recent study in the journal Health & Place highlights the inequality of life and death.
The work is the first of its kind in Canada. A team of researchers examined two disparities at the neighbourhood level in Metro Vancouver: gaps in life expectancies, and where common causes of death cluster.
The team combined data from BC Vital Statistics and census tracts. The most recent data comes from 2016, and the team tracked changes since 1991.
“It’s surprising to see such wide disparities in one of the healthiest cities in Canada,” said project lead Jessica Yu, who researches population health at the University of British Columbia.
The average male and female Metro Vancouverite are expected to live 82.5 and 86.6 years respectively. On paper, this looks good — the average Vancouver resident lives slightly longer than the average Canadian.
But the regional average obscures the places where life expectancies are closer to a country like Russia than Canada.
Aside from Vancouver’s Downtown Eastside, some of the old downtowns in other cities are home to people with lower-than-average life expectancies, such as New Westminster, Surrey, Langley and Maple Ridge. This is also where incomes are low, according to the census.
As for where people are expected to live the longest, residents of Richmond’s East Cambie and North Vancouver’s Upper Capilano are right up there with residents of the University Endowment Lands.
This shows that each of the region’s many cities, even tony North Vancouver, has inequality within it, Yu says.
Another startling discovery came from the team’s longitudinal examination of Metro Vancouver.
Between 1991 and 2001, the gap in life expectancies across the region shrunk. This means that all neighbourhoods were getting closer to the region’s average.
But between 2001 and 2016, the gap widened. This means that there’s a greater gap in years between the neighbourhoods with long expectancies and those with short ones — as shown in the 30-year difference between residents in the Downtown Eastside and the University Endowment Lands.
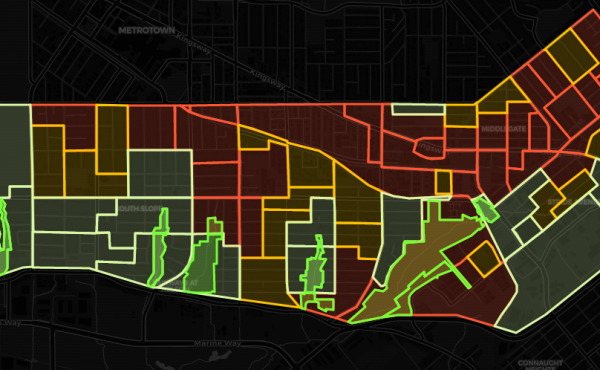
The team also examined 20 causes of death across the region, including injuries, cancers, various diseases, neurological disorders, substance use disorders and sexually transmitted infections.
The team found clusters of neighbourhoods that share common causes of death.
Yu said this fact should be brought to the attention of health and urban planners.
“What’s missing in those areas? Maybe education related to nutritional food access. If there’s a high mortality rate from HIV or STIs, they may consider implementing more testing. If there’s more mortality from prostate cancer, maybe we need to do a better job of screening.”
The team created a map for people to examine life expectancy and causes of death in their own neighbourhood.
The team has some ideas as to what’s behind the disparities: social determinants of health such as income and race, and systemic inequalities such as access to health care and nutritional food. How cities choose to densify also plays a role.
Looking at the team’s map, it might be tempting to ask, “Where should I live if I want to live longer?”
But Yu has two better questions for us as a society: “What can we do to improve our environmental conditions? And how can we work with governments to ensure those services to my health in my community?”
Since the 2016 census, The Tyee has published several maps that show various inequalities in the Lower Mainland: how suburban areas are becoming lower income; how COVID-19 has hit the neighbourhoods harder where working-class immigrants can afford to live; and who has access to green space, which is especially important during heat waves like the historic “heat dome” in 2021.
And two months ago, Tyee columnist Crawford Kilian, citing the same study, noted the interplay of politics, income gaps and life expectancy: “By a wild coincidence, 2001 was the year the BC Liberals won a huge majority over the NDP and ran the province under Gordon Campbell and then Christy Clark until 2017. British researchers noticed a very similar effect during Margaret Thatcher’s years in power: Around 1980, British and Japanese life expectancy were about the same, but then, as the U.K. income gap widened, British lives grew shorter. In Japan, with a much narrower income gap, life expectancy rose to among the highest on the planet.”
Metro Vancouver is showing more and more signs of social inequality, vulnerability to climate change and patterns in how people are dying. It’s crucial that we continue to collect this kind of granular data, says Yu, so that we can diagnose the places on the map where residents are disproportionally confronting mortality.
…
Christopher Cheung is a reporter at The Tyee, where this story originally appeared on January 17, 2022.