
Since the last Ontario provincial election in 2022, Toronto has been powerfully affected by the actions of Premier Doug Ford’s Conservative provincial government. Ford himself represents a Toronto riding, and it’s often said that he is acting like he regrets not being mayor of Toronto, a position he ran for unsuccessfully before becoming premier. His close involvement in Toronto issues certainly suggests this idea. In recent years, the provincial government has leased the West Island of Ontario Place to an Austrian spa company, leading to the complete devastation of that destination; it has abandoned the iconic Ontario Science Centre building; it has intervened in what is usually municipal jurisdiction to rip up bike lanes; it has re-uploaded the Gardiner and DVP expressways to the province (in a deal with the City); it has directed the building of new high-capacity transit; and it has established ambitious density goals around those transit stations and made other changes to zoning regulations. Some of these are bad for the city, others might be considered good even if disruptive, but all have significantly affected Toronto.
So the choices Torontonians made in the most recent provincial election (Feb. 27, 2025) are interesting – both in terms of what they show about how Torontonians have responded to the provincial government’s actions with regard to the city, and what they show about the mandate from Toronto voters for the provincial government and opposition parties.
Results
This analysis follows from my previous analysis of the 2022 Ontario provincial election results in Toronto, as well as a partial analysis from 2018. The results have been compiled from the Toronto Star’s data of the provincial election results (at time of writing, the Elections Ontario results are not yet in a simple format). The results compare easily to these previous elections, because although Ontario’s ridings were previously aligned with federal ridings (with some Northern Ontario exceptions), Premier Ford refused to update the riding boundaries to conform to the regular federal riding revision that is now in place at the federal level. This actually benefits Toronto, which would otherwise have lost a riding (from 25 to 24). But it means an even greater discrepancy in voters per riding, as lakefront ridings with rapidly increasing populations do not have that increase reflected in adjusted riding boundaries.
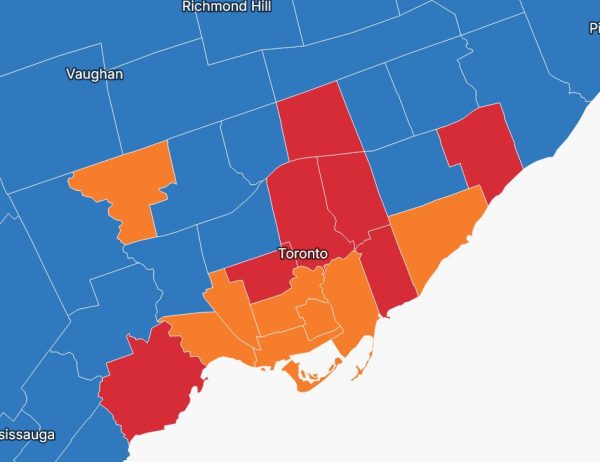
Overall, for the first time since 2014, the Liberals won the most votes in Toronto. While they gained seats as a result, they still ended up with fewer seats (7) in Toronto than the Conservatives (10) and the NDP (8). The Conservatives came second in the vote count, but won the most seats in the city. The NDP came quite a distant third in the vote count, but ended up only losing one seat, keeping one more than the Liberals. The Conservatives and NDP both have a considerably larger percentage of the seats than of the vote, at the expense of the Liberals.
Votes and seats in Toronto in Ontario’s 2025 provincial election*
| Votes | % of votes | Seats | % of seats | |
| Liberals | 339,449 | 38.5% | 7 | 28% |
| Conservatives | 300,035 | 34.0% | 10 | 40% |
| NDP | 205,855 | 23.3% | 8 | 32% |
| Greens | 24,009 | 2.7% | 0 | 0% |
| Other | 36,448 | 4.1% | 0 | 0% |
| Total | 881,787 | 100% (rounded) | 25 | 100% |
* Note that the vote counts are preliminary results and may vary slightly once final results are in.
In comparison to the 2022 Toronto results, the Conservatives actually got a few more votes and a slightly larger percentage of the vote (34%, up from 33.3%) , which aligns with their overall results in the province. The NDP lost some votes and dropped from 28% of the vote to 23.3%. The Greens also lost votes, dropping from 4.8% to 2.7%, which may reflect their having lost a couple of star candidates (including former Environmental Commissioner of Ontario Dianne Saxe, who is now a city councillor). The Liberals increased their percentage of the vote from 31.9% to 38.5%, and the absolute number of their votes increased more than the drop in NDP and Green support, suggesting somewhat more engagement among their potential voters than in the last election. There was a small increase in the overall number of votes – from 851,188 to 881,787 – most of which went to the Liberals.
While the Conservatives increased their vote a little, their numbers in Toronto are still well behind their overall provincial numbers (almost 43%). The NDP numbers, while lower than before, are still well ahead of their provincial numbers (18.6%). And even though they won the fewest seats, Toronto is a key base for the Liberals – they got considerably more of the vote than in the province as a whole (30%) and Toronto elected half of their 14-member caucus.
The most striking aspect of the Toronto results is how extraordinarily focused the NDP vote is. They won all but one of their seats by comfortable margins – only in Humber River-Black Creek were they run close, with not quite 200 votes more than the Conservative candidate. Their candidate Peter Tabuns in Toronto-Danforth got the most absolute votes and highest percentage of the vote in the city. But in the seventeen ridings they didn’t win, they were mostly in a very distant third place. There are only 4 ridings that they didn’t win where they got more than 3,000 votes (including the one they lost to the Liberals).
By contrast, both the Conservatives and the Liberals got more than 5,500 votes in every riding. The Liberals got over 7,000 votes in every riding except low-turnout Scarborough North (6,811). And they came second in all but the 2 suburban ridings the NDP won. Their vote was remarkably inefficient, but it suggests they have the potential to win all of these ridings (as in fact they have in the past).
Seat Changes
Although a different party got the most votes, this was another election of incremental change, like 2022, rather than dramatic change like 2018. The only seat gains were for the Liberals – two from the Conservatives and one from the NDP. In one of these, they may have benefitted from a split vote: in Don Valley North, the former Conservative MPP, forced to resign from the caucus, ran as an independent and got more votes than the winning margin for the Liberal candidate over the Conservative.
The other Liberal win from the Conservatives was Etobicoke-Lakeshore, which had been very close in 2022 (less than 1,000 votes). In 2025, the NDP vote collapsed (from 8,595 to 3,640). Both the Liberal and Conservative candidates got more votes than in the previous election – the population has continued to increase as new condos are built along the lakeshore, and as well the Ford anti-bike lane legislation was a controversial issue in the riding and may have spurred both supporters and opponents of bike lanes to come out to vote. The Liberals seem to have benefitted from the NDP collapse, but their increase in votes (from 17,136 to 25,195) was considerably more than just the difference in NDP votes, so they also attracted additional new voters.
Meanwhile, the riding they took from the NDP, Toronto-St. Paul’s, has long been a strong Liberal riding both provincially and federally (except for a recent by-election), and they ran something of a star candidate, a former CP24 news anchor.
Despite these wins, the overall seat results remain quite disproportionate, with the Liberals gaining comfortably the most votes yet the fewest seats. But it was close. The Liberals came within 500 votes of the Conservatives in 3 ridings (and within 600 in another). If Liberals had taken those 3 ridings (with just 1,500 more votes), they would have ended up with slightly more seats than their share of the vote (10/25, 40%), and the Conservatives quite a lot less (7/25, 28%).
Close Conservative-Liberal ridings
| Riding Name | Conservative | Liberal | NDP | Green | Others |
| Eglinton-Lawrence | 19,556 | 19,389 | 0 | 1,390 | 0 |
| Willowdale | 14,212 | 13,735 | 1,669 | 771 | 431 |
| York South-Weston | 11,143 | 10,999 | 8,101 | 844 | 611 |
One of those close seats was Eglinton-Lawrence, where the NDP candidate dropped out (too late for the party to replace her) to avoid splitting the anti-Conservative vote. The Conservative had won over the Liberals by just 524 votes in the previous 2022 election, with the NDP taking almost 4,000 votes, so this might have seemed like that would make a difference, yet it did not turn out that way. One could suggest the Greens were spoilers, with more votes than the winning margin – but although they got fewer votes than in the last election, they got more votes here than in all but one other Toronto riding, which suggests they may have got some votes of NDP voters who couldn’t stomach voting Liberal under any circumstances. As it turned out, the Conservative margin of victory was only slightly smaller than the 2022 election, suggesting most NDP voters in that riding – already a small hard core – preferred to stay home or vote Green rather than vote Liberal.
The extreme discrepancy in the NDP vote between ridings they won and most of the ones they lost also suggests “soft” potential NDP voters were already voting “strategically” for Liberals as the candidates most likely to defeat Conservatives in those ridings, while those who still voted NDP in those ridings were a hard core who might simply never vote for a Liberal. It’s something to bear in mind when people suggest the two parties should ally or merge.
Of the 8 ridings the NDP won, six were contests with the Liberals – all of their Old Toronto ridings – while in their two suburban ridings the Conservatives came in second (although the Liberals also got a fair number of votes in those ridings). Similarly, the Liberals were contesting with the NDP in their 2 Old Toronto ridings, and with the Conservatives in their 5 suburban or primarily suburban ridings. All of the Conservative wins were straight-up contests with the Liberals, with only York South-Weston being a three-way contest with a significant NDP vote. (York South-Weston is interesting because it’s the seat Premier Ford’s nephew Michael Ford took for the Conservatives from the NDP in 2022. The Conservatives held it despite losing that name recognition after Michael Ford decided not to run again, but now the second-place challenger is the Liberals rather than the NDP).
It will be interesting to compare these provincial results to the upcoming federal election results. It is looking likely that the federal Liberals will once again do much better than their provincial counterparts both in ridings where they compete with the Conservatives, and in those where they compete with the NDP, reinforcing the idea that a majority of Toronto voters are switch-hitters willing to vote for at least two different parties depending on circumstances.
Proportional Representation Scenario
What would it take to make the results more proportional to the vote? Many proportional systems add extra representatives to balance out the vote, and in my previous analyses I’ve imagined adding 5 additional representatives from Toronto to create party representation that is more closely aligned to the proportion of votes.
If we imagine doing so for this election, apportioning four of those seats is easy. If assigned to the Liberals, that would bring them up to 37% of the seats (11/30) – close to their share of the vote. However, the last seat causes complications. If given to the Liberals, it would take them over their vote percentage (to 40%), and more significantly, drop the Conservatives to below their vote percentage (33%), which does not seem acceptable. On the other hand, if given to the Conservatives, it would give them far more than their share of the vote (37%). Neither the Greens nor any other individual candidate/party came close to a reasonable proportion of votes that would call for a seat. The NDP, meanwhile, continues to be handily over-represented even without getting any additional seats.
| Party | Votes | % of votes | Seats | % of seats |
| Liberals | 339,449 | 38.5% | 11/12 | 37%/40% |
| Conservatives | 300,035 | 34.0% | 10/11 | 33%/37% |
| NDP | 205,855 | 23.3% | 8 | 27% |
| Greens | 24,009 | 2.7% | 0 | 0% |
| Other | 36,448 | 4.1% | 0 | 0% |
| Total | 881,787 | 100% (rounded) | 30 | 100% (rounded) |
If, instead, we only add 4 new members, the proportions come out almost exactly right for the Liberals and Conservatives (the NDP stays a little ahead).
| Party | Votes | % of votes | Seats | % of seats |
| Liberals | 339,449 | 38.5% | 11 | 38% |
| Conservatives | 300,035 | 34.0% | 10 | 34.5% |
| NDP | 205,855 | 23.3% | 8 | 27.6% |
| Greens | 24,009 | 2.7% | 0 | 0% |
| Other | 36,448 | 4.1% | 0 | 0% |
| Total | 881,787 | 100% (rounded) | 29 | 100% (rounded) |
I’m not sure if any proportional systems allow for a flexible number of additional seats, but it might be something to consider.
The wildcard system I once proposed could have that kind of flexibility, assigning only enough additional seats as needed to get close to proportionality. In the wildcard system, to assign those extra seats, the wildcard MPPs would be the four losing Liberal candidates with the most votes:
| Riding | Candidate (all Liberal) | Votes |
| Eglinton-Lawrence | Vince Gasparro | 19,389 |
| Etobicoke Centre | John Campbell | 19,358 |
| Spadina-Fort York | April Engelberg | 14,192 |
| Toronto Centre | Holly Rasky | 14,152 |
The top two wildcard candidates got more votes than seventeen of the 25 winning candidates in Toronto. The last one got more votes than four of the winning candidates.
So, the 2025 provincial election marked the return of the Liberals to getting the most votes in Toronto, as they had for several elections before 2018, after coming third behind the NDP and Conservatives in 2018 and second behind the Conservatives in 2022. But although this increase in votes led to their winning additional seats, they still have fewer seats in the city than either of the other major parties.