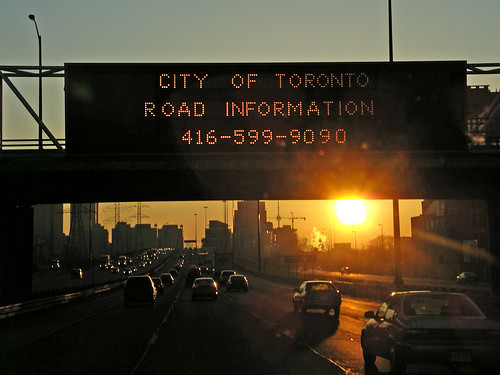
Cross-posted from Eye Daily.
1,700: The number of premature deaths in Toronto that exposure to smog pollutants contribute to each year.
6,000: The number of hospitalizations.
85, 69: The percentage of carbon monoxide and nitrogen oxide, respectively, that vehicles are responsible for emitting into Toronto’s air.
35: The percentage of the total greenhouse gas emission contributed by the transportation sector in Toronto.
75: The percentage increase in the number of vehicles traveling into and out of the city each morning over the past two decades.
67: The percentage of trips into Toronto made by single occupant vehicles.
20: The percentage of trips made by public transit (including GO bus, GO train, regional bus and TTC).
440: The number of premature deaths Toronto traffic pollution contributes to each year.
1,700: The number of annual hospitalizations associated with traffic pollution in Toronto.
1,200: The number of children estimated to experience acute bronchitis episodes per year as a result of traffic pollution.
67,000: The number of acute respiratory symptom days associated with traffic-related pollution.
200,000: The number of restricted activity days during which people spend days in bed or cut down on their usual activities.
30: The percentage reduction in motor vehicle emissions in Toronto that could save nearly 200 lives and result in $900 million in health benefits annually.
photo by Trevor Schwellnus


