Key Metrics Summary
Building: A 40-story residential building constructed of a reinforced concrete frame with a curtain wall facade on a site without underground parking, existing buildings, or tenant relocations. The calculations use construction costs alone as a reference point (via the Canadian Costs Guide 2023 by Altus Group). Other costs including land costs, development profit, etc. are NOT included. To be explicitly clear: the intent is not to imply that construction costs rise linearly with elevation, nor that they rise in a strict engineering or accounting sense.
-
- Using the Canadian Cost Guide 2023 by Altus Group as a reference point, the article applies a simplified algorithm to illustrate how unit prices can increase with elevation. The per-square-foot figures from Altus are not intended to represent literal, floor-specific construction costs. Rather, they serve as a surrogate input to model relative vertical pricing. In this illustrative framework, the square foot cost ranges from $330/sq. ft. at lower floors to approximately $600/sq. ft. at the highest levels. Remember, the latter is not a reflection of actual construction cost escalation but is used to understand and visualize how market value premiums accumulate with height.
- Based on above, the average Vancouver household would be priced out between the 3rd and 8th level, leaving over 30 stories out of reach to the average Vancouverite. If additional costs were included—such as land costs and development profits—the number of affordable floor levels would decline. This is the best possible scenario.
- Total Price Disparity across the building is $109M.
- Economic Inequality per Household is about $270,000.
- Social Costs of Inequality: is about $50,000 per household, or $20.3 million for the entire building.
Everyday Equivalents and Comparisons (40-story building without underground parking):
-
- Equivalent to building a new elementary school or community sports complex
- Covers hospital stays for 2,907 patients.
- Covers groceries for 1,696 families.
- Provides startup funding for 407 small businesses.
- 6-storey residential mid-rise Social Costs of Inequality is less than 5% of that of a 40-story building and all units would remain within the affordable range for the average Vancouver household.
Context
High-rise living is often associated with modernity, luxury, and prestige. However, behind the sleek facades of these towers lies a more complex reality. High-rise urbanism is not just reshaping skylines—it is actively influencing social stratification. As cities grow vertically, elevation increasingly correlates not just with views, but with socio-economic positioning. In many ways, this mirrors the exclusionary zoning policies that shape urban development.
Real estate trends in Vancouver and other major cities reveal a clear pattern: as floor levels increase, so do property prices. This pricing structure has become so ingrained in the real estate industry that it is rarely questioned. The lack of publicly accessible data further complicates efforts to analyze these trends, making it difficult to determine precisely how much property values increase with elevation.
Fortunately, the RoomVu blog analyzed MLS real estate data in 2019 and provided insights into this phenomenon. Although the data has not been updated, its findings remain useful. At the time, a 26th-floor apartment in Coal Harbour was priced at $5,840 per square foot, while a penthouse on the 48th floor was valued at $35.8 million. This price escalation highlights a clear economic divide, where higher floors are often occupied by the wealthiest residents.
Mid-level floors offer a more attainable—yet still expensive—version of high-rise living. Upper-middle-class residents benefit from advantages such as better lighting and reduced street noise, but they do not experience the same level of exclusivity as penthouse owners. Meanwhile, lower floors tend to be the most affordable, but they also often come with fewer of the benefits associated with high-rise luxury. This vertical hierarchy reflects broader economic disparities, where status and opportunity are unevenly distributed within urban environments.
Although real estate prices have shifted since 2019, the percentage increases per floor still provide a useful framework for understanding social stratification within high-rise buildings:
- Floors 1-10: Approx. 3% increase per floor
- Floors 10-25: Approx. 0.7% increase per floor
- Floors 25-35: Approx. 1.2% increase per floor
- Floors 35 and up: Approx. 2.3% increase per floor
In the absence of newer data, these figures offer a baseline for examining how vertical development influences urban inequality. More specifically, one can insert a surrogate input into the algorithm—in this case, the figures from the Canadian Costs Guide 2023 by Altus Group to model relative vertical pricing. It is worth noting that I could have used average unit sales prices instead—or even a fictional starting value—the resulting pattern of vertical pricing would have remained unchanged.
This being the case, it’s important note that the outputs from the algorithm are not literal, floor-specific construction costs, but as surrogates to model vertical stratification. In reality, construction costs do not rise linearly with elevation even though there is a correlation between construction costs and sales prices, in broad terms.
The point here is to illustrate relative increases, not calculate actual construction costs. More specifically, the goal is to draw attention to how the value captured on higher floors (through price premiums) is not matched by a proportionate increase in actual (construction) cost—highlighting how profit, not cost, is the primary driver of vertical price gradients.
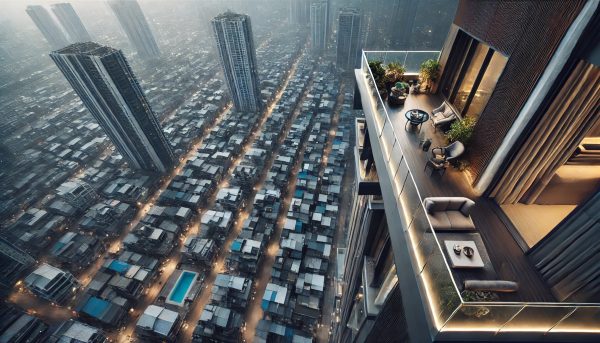
Beyond economic factors, however, high-rise living also reinforces a symbolic hierarchy. Unobstructed views of natural landscapes and cityscapes are often considered status symbols. Those residing on higher floors benefit from both the aesthetics and the perception of having a privileged vantage point over the city. By contrast, lower-floor residents, whose views may be obstructed or nonexistent, experience a different reality. The lack of access to expansive views can reflect broader patterns of exclusion within urban development.
High-rise amenities further contribute to social divisions. Many luxury towers boast concierge services, rooftop gardens, private gyms, and lounges, yet these features are not equally accessible to all residents. Penthouse occupants often enjoy exclusive access to private elevators, rooftop terraces, and premium services, while those living lower in the building may face restrictions on shared amenities. These buildings function as microcosms of the city itself, where access to resources is dictated by economic status and exclusivity is embedded into architectural design.
Beyond tangible disparities, high-rise living also has psychological effects. For those residing at the top, physical elevation can foster a sense of detachment from the city below. Everyday concerns such as traffic, noise, and social issues seem distant—both literally and figuratively. In some cities, such as Caracas, Venezuela, the wealthiest residents bypass urban streets altogether, commuting via helicopter from one rooftop to another.
Conversely, lower-floor residents often look up at the unattainable luxury above them, reinforcing social divisions and deepening perceptions of inequality and exclusion.
This is why many argue that residential towers perpetuate a form of spatial apartheid through vertical stratification, exclusive access, and segregated infrastructure. While not always explicitly designed to segregate, high-rises often produce a deeply divided urban experience when driven by profit.
So What?
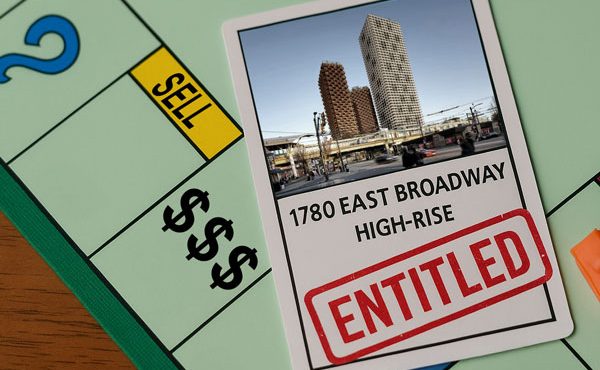
Using the RoomVu data as a reference point, we can consider the implications of a typical 40-story building—the standard height of many new towers near SkyTrain stations under British Columbia’s Transit-Oriented Development regulations, the Broadway Plan, and other large-scale projects such as the proposed Safeway redevelopment at 1780 East Broadway.
Assuming a conventional reinforced concrete structure with Vancouver’s signature curtain wall design and no underground parking on an empty site, the social and economic impacts using construction cost alone as a reference point (excluding variables like land costs and developer profits) are substantial.
For example, identical 1,000 sq.ft. apartment units would see their cost increase by approximately 83% from Floor 1 to Floor 40—equating to an additional $10,000–$11,000 per unit per floor across the first 10 stories alone. In practical terms, this means that an apartment on the 10th floor would cost about $100,000 more than one on the first floor solely due to height.
Based on Vancouver’s median household income of $82,000, an “affordable home” would be priced between $350,000 and $400,000. However, even before factoring in land costs, development fees, and other expenses, the construction costs of a high-rise alone would price the average Vancouverite out of a unit above the 3rd to 8th floor—leaving over 30 stories effectively out of reach. If additional costs were included—such as land costs and development profits—the number of affordable floor levels would drop. This offers the best possible scenario where no profits are desired, and other related costs (land, design, etc.) are negligible.
The Social Cost of Inequality in such a building is estimated at $50,000 per household, or $20.3 million for the entire building—equivalent to the cost of constructing a new elementary school or community sports complex. Alternatively, this amount could fund hospital stays for 2,907 patients, provide startup funding for 407 small businesses, or cover groceries for 1,696 families.
By comparison, a six-story wood-framed residential mid-rise has an estimated Social Cost of Inequality of approximately $950,000, which is less than 5% of that of a 40-story tower. Importantly, every single unit within this building type would remain within the affordable range for the average Vancouver household.
Food for Thought
High-rise urbanism is more than a response to population growth—it reflects and reinforces economic, social, and psychological divisions in modern cities. Without careful consideration, vertical cities evolve into rigid hierarchies, where privilege rises while others remain literally beneath it. Within the context of contemporary cities, towers are spatial instruments of exclusion, reflecting and amplifying socio-economic divides.
A particularly stark example of this dynamic is the use of “poor doors” in mixed-income towers, where social housing is integrated into high-rise developments but maintains separate entrances and amenities. Several proposed buildings within the Broadway Plan and British Columbia’s Transit-Oriented Area zones incorporate these “poor doors.” The acceptance of such practices within current policies raises important questions about how contemporary urban planning defines equity.
- If high-rise living functions as a vertical form of exclusionary zoning and spatial apartheid, how does this align with efforts to promote “inclusionary zoning”?
- Can towers be designed to encourage social integration rather than reinforce divisions, especially within a market-driven system that monetizes height differences to meet profit targets?
- Given the inherently stratified nature of high-rise buildings, what are the broader urban consequences when entire neighbourhoods or districts are planned to prioritize these structures?
- How do planners and decision-makers condemn discriminatory urban planning practices while simultaneously endorsing architectural forms that reinforce privilege and exclusion?
Without intentional policies and strategic planning, high-rise living will not only shape city skylines—it will also reinforce social inequalities for generations to come.
***
Calculations and Assumptions
BUILDING (40-STOREY)
BUILDING ASSUMPTION OVERVIEW: A 40-story residential building constructed of a reinforced concrete frame with a curtain wall facade on a site without underground parking, existing buildings, or tenant relocations. Although I could have used average unit sales prices instead—or even a fictional starting value—the calculations use construction costs outlined in the Canadian Costs Guide 2023 by Altus Group as a reference point and input into the algorithm. Other costs including land costs, development profit, etc. are NOT included.
Footprint
-
- Assumption: The building has a rectangular footprint with dimensions of 100 feet by 100 feet.
- Calculation: 100 ft × 100 ft = 10,000 ft² (building footprint).
Total Above-Ground Floor Area
-
- Assumption: The building has 40 stories, and each story has the same floor area as the footprint.
- Calculation: 10,000 ft² × 40 stories = 400,000 ft² (total above-ground floor area).
Cost Increase Per Floor Assumptions/Algorithm
Base construction cost: $330/sqft (Floor 1) via Canadian Costs Guide 2023 by Altus Group.
Price increase per floor:
-
-
- Floors 1-10: 3% per floor.
- Floors 10-25: 0.7% per floor.
- Floors 25-35: 1.2% per floor.
- Floors 35-40: 2.3% per floor.
-
Formula
-
-
- Price per sq. ft. (Floor n) = Price per sq. ft. (Floor n−1) × (1 + Percentage Increase)
-
Calculations
Floors 1-10 (3% Increase Per Floor)
-
-
- Floor 1: $330/sqft
- Floor 2: $330 × 1.03 = $339.90/sqft
- Floor 10: $330 × (1.03)^9 = $430.50/sqft
-
Floors 10-25 (0.7% Increase Per Floor)
-
-
- Floor 11: $430.50 × 1.007 = $433.51/sqft
- Floor 25: $433.51 × (1.007)^14 = $478.50/sqft
-
Floors 25-35 (1.2% Increase Per Floor)
-
-
- Floor 26: $478.50 × 1.012 = $484.24/sqft
- Floor 35: $484.24 × (1.012)^9 = $537.50/sqft
-
Floors 35-40 (2.3% Increase Per Floor)
-
-
- Floor 36: $537.50 × 1.023 = $549.86/sqft
- Floor 40: $549.86 × (1.023)^4 = $602.50/sqft
-
Total Cost Per Floor
Assumptions
-
-
- Each floor contains 10,000 sq.ft. of residential space.
-
Formula
-
-
- Total Cost (Floor n) = Price per sq.ft. (Floor n) × 10,000
-
Calculations
-
-
- Floor 1: $330 × 10,000 = $3,300,000
- Floor 10: $430.50 × 10,000 = $4,305,000
- Floor 25: $478.50 × 10,000 = $4,785,000
- Floor 35: $537.50 × 10,000 = $5,375,000
- Floor 40: $602.50 × 10,000 = $6,025,000
-
Price Disparity between Floors
Calculation
Price Disparity = Total Cost (Floor 40) − Total Cost (Floor 1)
6,025,000 − 3,300,000 = $2,725,000 per floor
Total Price Disparity in the Building
Calculation
-
- Total Disparity = Price Disparity per Floor × 40
- 2,725,000 × 40 = $109,000,000
Economic Inequality per Household
Assumptions
-
- 400 households in the building (40 floors × 10 households per floor).
Calculation
-
- Economic Inequality per Household = Total Disparity/Number of Households
- 109,000,000 ÷ 400 = $272,500 per household
Social Cost of Inequality
Assumptions
-
- Social cost is 15% of economic disparity.
Calculation
-
- 272,500 × 0.15 = $40,875 per household
REFINING THE CALCULATION
Additional Costs Per Household
-
- Health Impacts: $5,000
- Environmental Costs: $2,000
- Opportunity Costs: $3,000
Revised Social Cost per Household
-
- 40,875 + 5,000 + 2,000 + 3,000 = $50,875 per household
Revised Total Social Cost
EVERYDAY COMPARISON
- Cost of Building a School: Equivalent to building 1 new elementary school ($20 million).
- Healthcare Costs: Covers hospital stays for 2,907 patients (20,350,000 ÷ 7,000).
- Affordable Housing Units: Funds 81 affordable housing units (20,350,000 ÷ 250,000).
- Public Transit Investment: Equivalent to 1 new subway train ($20 million).
- Annual Salaries for Teachers: Pays 291 teachers for one year (20,350,000 ÷ 70,000).
- Grocery Costs for Families: Covers groceries for 1,696 families (20,350,000 ÷ 12,000).
- Climate Action Initiatives: Funds planting 40,700 trees (20,350,000 ÷ 500).
- Small Business Support: Provides startup funding for 407 small businesses (20,350,000 ÷ 50,000).
- Childcare Subsidies: Subsidizes childcare for 2,035 children (20,350,000 ÷ 10,000).
- Sports and Recreation Facilities: Equivalent to building 1 community sports complex ($20 million).
BUILDING (6-STOREY)
BUILDING ASSUMPTION OVERVIEW: Wood-framed 6-story residential building on a site without existing buildings or tenant relocations.
ASSUMPTIONS:
-
- Construction cost: $245/sqft (base cost for the first floor) via Canadian Costs Guide 2023 by Altus Group.
- Price increases: 3% per floor for floors 1-6.
- Floor area: 10,000 sqft per floor (same as before).
- Households: 10 per floor, totaling 60 households (6 floors × 10 households).
Price per Square Foot for Each Floor
Assumptions:
-
- Base construction cost: $245/sqft (Floor 1).
- Price increases: 3% per floor for floors 1-6.
Formula:
-
- Price per sqft (Floor n)=Price per sq.ft (Floor n−1)×(1+0.03)
- Calculations:
Floor 1: $245/sqft. - Floor 2: 245×1.03=252.35/sqft.
- Floor 3: 252.35×1.03=259.92/sqft.
- Floor 4: 259.92×1.03=267.72/sqft.
- Floor 5: 267.72×1.03=275.75/sqft.
- Floor 6: 275.75×1.03=284.02/sqft.
Total Cost per Floor
Assumptions:
-
- Each floor has 10,000 sqft of residential space.
Formula:
- Total Cost (Floor n)=Price per sqft (Floor n)×10,000
Calculations:
- Floor 1: 245×10,000=2,450,000.
- Floor 2: 252.35×10,000=2,523,500.
- Floor 3: 259.92×10,000=2,599,200.
- Floor 4: 267.72×10,000=2,677,200.
- Floor 5: 275.75×10,000=2,757,500.
- Floor 6: 284.02×10,000=2,840,200.
Price Disparity Between Floors
Calculation:
Price Disparity: 2,840,200 (Floor 6) − 2,450,000 (Floor 1) = $390,200 per floor.
Total Price Disparity in the Building
Calculation – Total Disparity:
-
- 390,200 × 6 floors = $2,341,200.
Economic Inequality per Household
Assumptions:
-
- 60 households in the building (6 floors × 10 households per floor).
Calculation:
-
- 2,341,200 ÷ 60 = $39,020 per household.
Social Cost of Inequality
Assumptions:
- Social cost is 15% of economic disparity.
Calculation:
- Social Cost per Household: 39,020 × 0.15 = $5,853 per household.
Total Social Cost:
- 5,853 × 60 = $351,180.
Calculation Refinement
Additional Costs:
-
- Health Impacts: $5,000 per household.
- Environmental Costs: $2,000 per household.
- Opportunity Costs: $3,000 per household.
Revised Social Cost per Household:
Revised Social Cost per Household
-
- 5,853 + 5,000 + 2,000 + 3,000 = $15,853
Revised Total Social Cost
Vancouver Median Household Income and Affordable Homes
As of the 2021 Census, the median household income in Vancouver, British Columbia, was $82,000 before taxes and $72,000 after taxes.
Housing affordability is typically assessed using two key ratios:
-
- Gross Debt Service (GDS) Ratio: This is the percentage of your gross monthly income that covers housing costs, including mortgage payments, property taxes, heating, and 50% of condominium fees (if applicable). Lenders generally prefer this ratio to be at or below 35%.
- Total Debt Service (TDS) Ratio: This ratio represents the percentage of your gross monthly income required to cover all debts, including housing costs and other obligations like car loans and credit card payments. Lenders typically prefer this ratio to be at or below 42%.
Assumptions for Calculation:
-
- Gross Annual Household Income: $82,000
- Down Payment: 20% of the home’s purchase price
- Mortgage Interest Rate: 5.87% (average rate as of March 2025)
- Amortization Period: 25 years
- Property Taxes: 1% of the home’s purchase price
- Heating Costs: $150 per month
- No Other Debt Obligations: Assuming the household has no additional monthly debt payments
Calculations:
-
- Monthly Gross Income: $82,000 ÷ 12 months = $6,833
- Maximum GDS Allowable: 35% of $6,833 = $2,392
- Estimated Monthly Non-Mortgage Housing Costs:
- Property Taxes: 1% of the home’s price ÷ 12
Heating Costs: $150
Total Non-Mortgage Costs: (0.01 × Home Price ÷ 12) + $150 - Available for Mortgage Payment: $2,392 – Non-Mortgage Costs
Mortgage Calculator: Inputting the available mortgage payment, interest rate, and amortization period will yield the maximum mortgage amount. Adding the down payment will provide the maximum affordable home price.
For a home price of $400,000:
-
- Down Payment: 20% of $400,000 = $80,000
- Mortgage Amount: $400,000 – $80,000 = $320,000
- Monthly Mortgage Payment: Approximately $2,027
- Property Taxes: 1% of $400,000 = $4,000 annually; $4,000 ÷ 12 = $333 per month
- Total Monthly Housing Costs: $2,027 + $333 + $150 = $2,510
- GDS Ratio: $2,510 ÷ $6,833 ≈ 37%
- This GDS ratio is closer to the preferred 35% but still slightly above.
Conclusion:
Given the assumptions and current interest rates, a household with Vancouver’s median income of $82,000 may afford a home priced between $350,000 and $400,000, provided they make a 20% down payment and have minimal additional debts. Therefore, the average Vancouver household can afford units between between the 1st and 8th level of a 40-storey high rise, based on the construction costs outlined above. Note, however, that actual affordability can vary based on individual circumstances, interest rates, and housing market conditions.
***
Other articles in the Rising High, Falling Short series:
- Rising High, Falling Short: Introduction
- Rising High, Falling Short: Construction-Related Carbon Emissions
**
Erick Villagomez is the Editor-in-Chief at Spacing Vancouver and teaches at UBC’s School of Community and Regional Planning. He is also the author of The Laws of Settlements: 54 Laws Underlying Settlements Across Scale and Culture.