
In the past 24 hours not one but two interesting online interactive maps have been published to explore the age of the city’s buildings. One of them was created by the good people of hometribe.ca, and the other by myself personally with data assistance by a good friend and GIS master named Rickard Hansen.
check them both out.
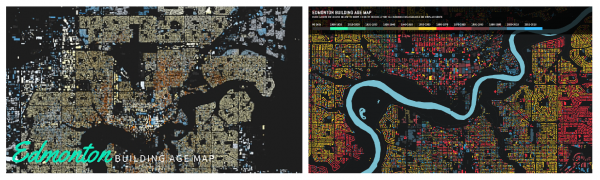
Home Tribe has done some nice research to coordinate their building layers to boom and bust cycles in the city’s development:
View Home Tribe Map by historical era
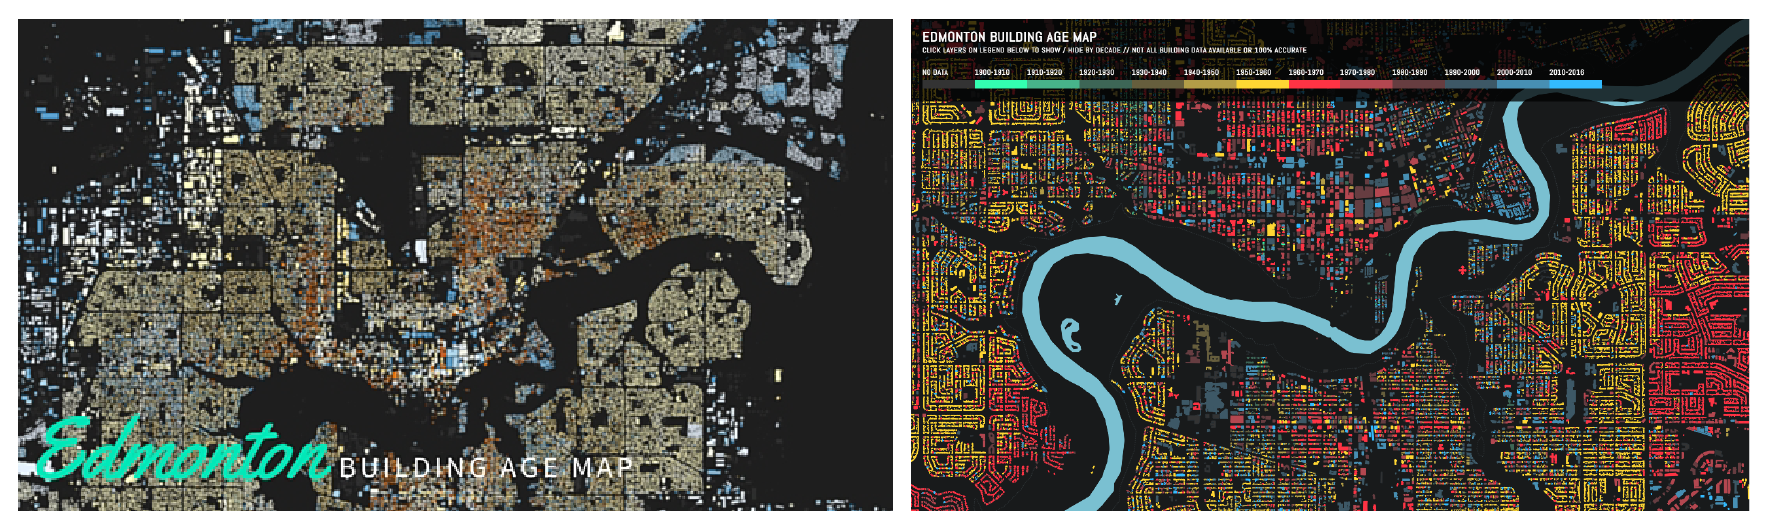
buildings simply separated by decade:
View map by decade
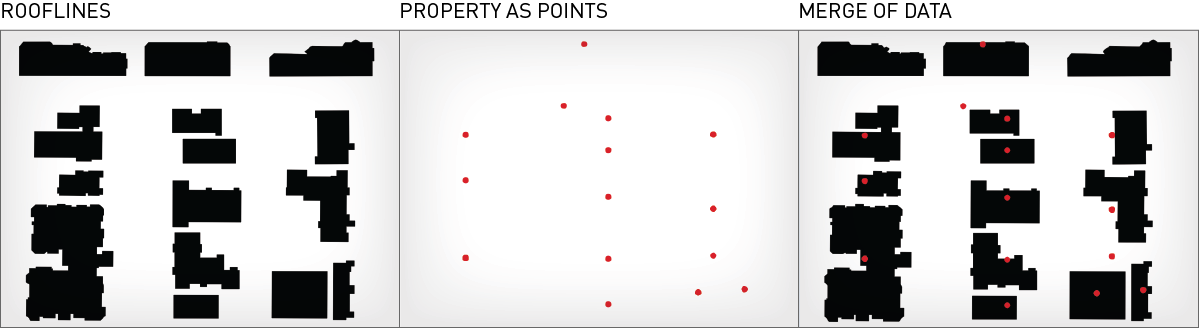
Both as I understand are a response to a call by Beta City YEG to replicate a previously completed version for City of Chicago. Based on data released in the Edmonton open data catalogue the maps are created by merge of two sets: rooflines, and property information data.
The merge of data is not without its issues and inaccuracies. The rooflines are a data set of all of the ‘shape’ polygons that define the outlines of buildings such as houses, garages, and commercial buildings on a map, but contain no additional information such as zoning, building age, etc.
The property data contains information such as age built, zoning, house number, street name, address, etc., but nothing about geometry of buildings. Latitude and longitude are included and allow one only to plot points.
In order to get the building shapes to inherit the property data, a spatial merge using GIS software had to occur, and will not be without inaccuracies. As you can see following, the point data and building data do not always overlap, and the software is instructed to do a ‘close analysis’ and decide to merge.
 Nevertheless, the data presented is a big picture representation of overall development history of the city.
Edit: there have been a number of queries and comments such as “the data is incorrect as I used to live in a 100 year old house and it shows as having been built in 1980”. There are the inaccuracies as listed above. Additionally, the accuracy is only as good as the base data itself. See the link to the open data. The age data is based on the column ‘Actual Year Built’ which says ‘original year of primary building’. As can be seen visually in areas of infill like Westmount or Inglewood redevelopment changes the age of the building. It is unclear what level of renovation might also affect age built. It is also noted that there are only two buildings in the entire 370,000 rows that are older than 1900 which is in reality unlikely.
Jason Pfeifer is an Edmonton based Landscape Architect and Urban Designer, and Principal of PD+A Studio, a boutique service-oriented interdisciplinary design firm.
One comment
Dear Spacing Edmonton, I couldn’t help but share this awesome interactive map with my followers on “The Talk of Edmonton.” I’m sorry this map hasn’t been getting the recognition it deserves. This is simply incredible. Thank you for creating this. I LOVE IT!
Check out the story here: http://thetalkof.com/edmonton/really-cool-interactive-map-showing-edmontons-incredible-growth-from-the-1900s-to-2016/