

Toronto Public Health published a report this week analyzing the police statistics for collisions where vehicles hit pedestrians and cyclists, Pedestrian and Cycling Safety in Toronto (PDF).
The report counters some common myths that are heard whenever vehicle-on-pedestrian collisions are reported in the news. The first reaction, from police and the public, is often that pedestrians are always jaywalking, so their own behaviour is the cause of the problem.
However, the report’s analysis of the statistics (Table 18, p. 27) shows that, in 67% of cases, pedestrians had the right of way when they were hit by a vehicle. Only 19% of the time were the pedestrians crossing without the right of way, and the other 14% cannot be determined.
Another common reaction is that pedestrians are hit because they’re texting or on the phone or otherwise not paying attention. But the report’s analysis shows that pedestrians were inattentive in some way only 13% of the time (p. 30-31).
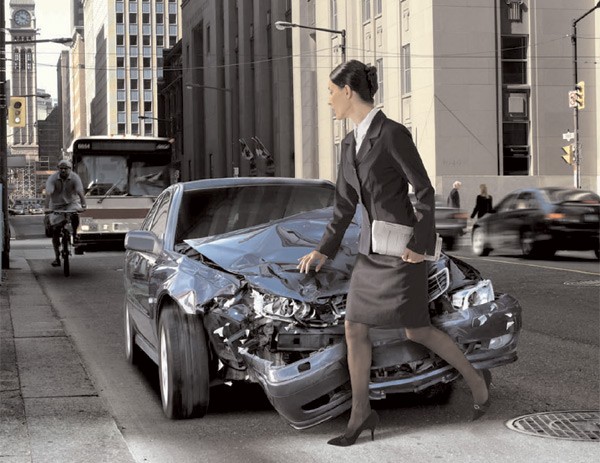
In other words, most pedestrians are hit while they are obeying the law, and paying attention to their surroundings, but a vehicle comes at them in a way they can’t possibly see, predict or avoid. It is time to stop the knee-jerk blaming of the victim whenever pedestrians are hit.
The report’s detailed analysis does identify one type of pedestrian who is disproportionately likely to be taking risks or not paying attention when hit — young people (children and youth up to age 19). Even then, it is only a minority. However, this finding suggests the value of integrating walking safety into the curriculum of Toronto school boards, something that is long overdue.
The report uses the same type of police report statistics as the City Transportation Department’s old Pedestrian Collision Study (PDF), but although it is more concise, it goes into some in-depth analysis that the old study failed to do. Notably, it analyzes collisions by the type and speed of the road on which they happened (p. 19-21). As has long been suspected, the faster the road, the more likely pedestrians will be killed or injured there. Roads at 60 km/hr were responsible for 57% of deaths and 54% of injuries. Those at 50 km/hr were responsible for 33% of deaths and 34% of injuries. Between them, major arterial roads (which most often have these speeds) were responsible for 67% of collisions despite taking up only about 14% of the road network. The number of injuries and deaths was much lower on 40 km/hr roads.
Equally notable was that less than 1% of injuries, and no deaths, happened on streets signed at 30 km/hr. It’s that kind of statistic that led Toronto and East York Community Council (TEYCC) to pass a decision this week to lower the speeds on all local streets (over which the community council has jurisdiction, unlike arterials) to 30 km/hr from 40 km/hr (or sometimes 50 km/hr).
Staff argued that only a small proportion of collisions or injuries happen on local roads. However, the statistics in the staff report (PDF), which go into even more detail than the Toronto Public Health report, showed just what a difference those 10 km/hr in speed can make. In the Toronto-East York district, there are currently 152.1 km of local streets signed at 30 km/hr, and 387.1 km of local streets signed at 40 km/hr (p. 8), or 2.5 times as much. On the 30 km/hr streets, over the 5 years 2009-2013, there were 28 collisions causing injury, and no deaths (Table 8, p. 7). On the 40 km/hr streets in the same period, there were 475 collisions causing injuries and 2 deaths — that’s 17 times as many collisions on only 2.5 as many kilometres of local streets.
Not surprisingly, the Toronto Public Health report’s recommendations reiterate its previous call to reduce local street speed limits to 30 km/hr throughout the city, and reduce the default speed limit to 40 km/hr for arterial roads. It also calls for infrastructure changes to calm traffic, and awareness and education campaigns for all road users.
Image from City of Toronto “We’re all pedestrians” safety campaign, 2005.
15 comments
Great article/research..thanks for sharing. Curious if there’s any data on Cyclist->Pedestrian collisions? One of the rebuttals around bikes is “all those crazy cyclists running reds and driving on the sidewalk”… To pre-emptively counter this, I’m wondering if the city tracks Pedestrian incidents, by vehicle type (bike, scooter, car, bus).
One condition that likely falls into the “undetermined” category would be drivers making right-hand turns on red at speed, or a wide left-hand turn on green made jack-rabbit style. My closest calls with being hit have occurred while I am crossing an intersection on a green light, only to have a turning car swing in front of me from a cross street, or from behind me if they are making a left.
Another hazard is presented by drivers who don’t stop at a cross walk because I haven’t reached their lane as I am crossing. Many times, there will be a second vehicle behind the first, that will continue at speed under the assumption that the cross walk is clear. There are intersections in my neighbourhood where it is frankly safer to jaywalk, because the roadway in both directions is more visible. Many drivers pay notice only to other motor vehicles when they enter intersections.
Not sure about the inattentiveness outcome. How would police know? It would require a self-report on the part of the pedestrian and how many would admit to being on their phone or iPod. I don’t believe the result.
However, no question that the more cyclists there are on the road, the more drivers are aware of them and the more likely to look out for them. Common sense.
So how much traffic was on the 40 km/h street????
How much traffic was on the 30 km/h street???
If one were to compare crashes on arterial roads to residential without comparing cars and km/h traveled it would show the low use residential roads as “safer”.
YOU ALWAYS need to use distance traveled. Not using it is misleading.
IN fact basing speed limits on “impact” speed and not what really caused is also misleading.
Let me also add that I don’t see where playing speed limit politics will work.
Quote on that 2007 report:
Collision Types # of Cases %
Intersection
1. Vehicle turns left while pedestrian crosses with right-of-way at intersection 632 13%
2. Vehicle turns left while pedestrian crosses without right-of-way at intersection 196 4%
3. Vehicle turns right while pedestrian crosses with right-of-way at intersection 422 9%
4. Vehicle turns right while pedestrian crosses without right-of-way at intersection 117 2%
5. Vehicle is going straight through intersection while pedestrian crosses with right-of-way 232 5%
6. Vehicle is going straight through intersection while pedestrian crosses without right-of-way 654 14%
Total at Intersection 2,253 47%”
Of the intersection crashes either it was a turning issue (where cars are NOT going very fast) or straight thru of which MORE were CASUSED BY THE PEDESTRIAN CROSSING WITHOUT RIGHT OF WAY!
Quote on the rest:
“Non-Intersection
8. Pedestrian hit at mid-block location 1,042 22%
9. Pedestrian hit at private driveway 347 7%
10. Pedestrian hit at pedestrian crossover (PXO) 232 5%
11. Pedestrian hit on sidewalk or shoulder 163 3%
Total at Non-Intersection 1,784 37%
Other / Unknown
55. Pedestrian hit in parking lot 508 11%
99. Other / Unknown 230 5%
Total at Other/Unknown Category 738 16%”
NO SPEED LIMIT “reduction” will really work as lets see.
28% were at intersections INVOLVING TURNING VEHICLES!
14% were at intersections involving PEDESTRIANS CROSSING AGAINST RIGHT OF WAY!
22% were mid block (no doubt JAYWALKING).
7% hit on private driveways
3% on sidewalks (how many were DUI on the driver?).
11% in PARKING LOTS!
85% WOULD NOT BE STOPPED BY A SPEED LIMIT “reduction”.
IT IS LYING TO CLAIM a speed limit manipulation would really make things “much” safer.
Yup, crossing mid-block basically eliminates the chance of some jackass looking the other way while making a turn and running over you from behind.
The stats Stephen lists fog the picture of the main argument of a speed reduction: if pedestrians do not get hit at 40km/h but at 30km/h their chance of living is far greater. But, according to Stephen, it’s not worth trying to make those other 15% of collisions safer.
It’s rather obvious the authors of this report had an outcome in mind before they started to “analyze” the data. I find it very strange that most reports and police forces say that pedestrians are responsible for about 50% of pedestrian/driver accidents but by mashing together data these guys come up with less than 20%. I also saw no mention of distracted pedestrians being a cause of accidents. This “research” comes across as another anti-car diatribe. The authors should be embarrassed and any city council that makes policy changes based on this shoddy (read unethical) research should be voted out.
The 30 km/hr and 40 km/hr streets in the comparison are all local streets, and so have broadly similar amounts of traffic.
Note that speed limit changes would directly impact all of the cases where vehicles are going straight through an intersection or at mid-block (whether the pedestrian has the right of way is irrelevant). Given the large differences in the collision statistics between different speeds of streets, it appears that speed limits also do have an impact on the frequency and severity of collisions resulting from turns – they could, for example, be taken at higher speeds or with more acceleration.
Note that Toronto Public Health staff are specialists who have done statistical analysis on many reports over the years.
I have a question – is the rate of injuries/deaths per vehicles travelling on the road relevant as a statistic? That is, if you have 2500 vehicles travelling on that road, and 722 deaths/injuries occur on that road, then the death/injury rate is 0.288 per number of vehicles that used the road. That’s a high rate – that’s the local road rate, based on the data in the report – and it’s almost as high as the major arterial rate of 0.299 (20000 vehicles, 5988 deaths/injuries).
So, yes, since more vehicles travel on the arteries, using straight numbers, YES, they appear to be more dangerous. But if you look at the rates of accidents, it turns out that the roads are a lot more equal than we thought. (I’m not providing an in-depth analysis here – just look at Tables 3 and 7 in the report and compare the data.)
Rachelle – those numbers are just the theoretical numbers of cars on a street of that type, not actual vehicle counts for all of those streets.
Table 9 provides proportional numbers, of collisions per km of each type of street in Toronto. You’ll see the rate per km is higher for major arterials, and very low for local streets, since there are a lot more km of local streets in Toronto. As for the actual volumes of vehicles, the researchers note “it is also important to note that major arterial roads have the heaviest pedestrian, cyclist and vehicle volumes, which we were unable to estimate with the data sources available.”
However, if you do a really crude calculation, multiplying the number of local road-kms with their theoretical capacity, and doing the same for arterials, you’ll find local roads, altogether, have about half the total theoretical vehicles-kms as arterials – but only 1/8 of the collisions.
Bravo. Great analysis!
Stephen, if simply changing some signs can reduce the number of injury and death caused in that 15% segment, I’d say it is fantastic and super-economical. You know, the 1.1m cost to change those signs equals to roughly 500 days of cost of hospitalization. It does not take a lot of accidents before that money goes down the drain, not to mention the human cost. Also you will probably be surprised by the volume of the 30km streets. ATM there is only one street in my neighbourhood that is 30km, the rest is all 40. The 30 one is the busiest, as it is a two way street cut across the neighbourhood, regularly used by commuters as a alternative to the thoroughfare to get around congestion. Because of that the neighbourhood successfully get it down to 30km, along with a bunch of traffic calming measures. It is still the busiest, but at least the traffic is mostly slow.
There are fewer injuries on residential streets because there is considerably less traffic, not because of the posted speed limit. If the street is wide, most drivers will do 40 or even 50 along a 30-mph street. Our straight, wide streets and roads are built for speed. The only thing that will ever slow a driver down is to make roads more narrow and to introduce bends. This can be achieved by putting in bike lanes at a different pavement level or allowing parking on both sides of the street, or alternating sides for parking every block or half-block, or building planters (like the ones on Moore Ave. west of Bayview). Then drivers have to slow to navigate safely. Spend money on these measures, not on signs that will largely be ignored.
Note that the comparison between 30 km/hr and 40 km/hr streets in the article is all within residential streets, with comparable traffic levels (in fact, many 30 km/hr streets are busier because busy streets are more likely to prompt local communities to ask for traffic calming).
It would of course be great to implement infrastructure changes, but these are vastly more expensive and slower to implement than changing speed limits. Reducing speed limits is a quick and inexpensive way to get some results. It would definitely be desirable to follow that up with infrastructure changes over time.