Recently, Etobicoke MP Yvan Baker joined a small group of residents to publicly denounce the Bloor Street bike lanes. In a statement shared on his website, Baker laid out what he described as a common-sense objection to the lanes, claiming they’ve led to “a predictably devastating impact on traffic flow,” worsened emergency response times, increased emissions, and hurt small businesses. He concluded with a line meant to inoculate his argument from criticism:
“I should add that I am an avid cyclist and have cycled extensively in the area for years.”
It’s the kind of line that signals both authority and neutrality: “Trust me, I ride too.” But in practice, it’s a sleight of hand. Because the facts don’t support his case. And if you’re going to come for the most successful complete street project Toronto has implemented in years, you better come with something more than anecdotes and armchair urbanism.
Let’s talk about traffic
The idea that bike lanes are “devastating” for traffic flow doesn’t hold up. We’ve known for years that road widening and car-priority policies induce demand—the more lanes you add, the more drivers show up to fill them. The reverse is also true: when road space is reallocated, drivers adapt, shift travel times, and even change modes.
The Bloor Street West Complete Street Extension has been studied closely by the City of Toronto, and their official reports show no sign of collapse, just changes consistent with design goals.
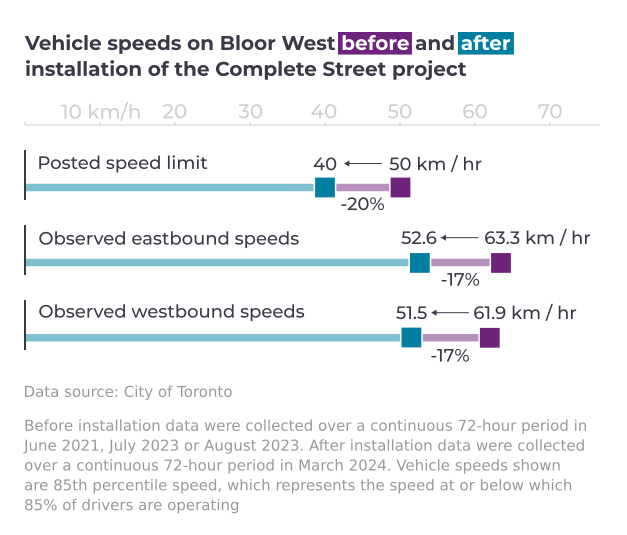
According to the City of Toronto’s Bloor Street West Complete Street Extension – Phase 1 Evaluation Report (2023) (Runnymede → Aberfoyle) shows 85th percentile vehicular speeds dropped an average of 17%—from ~63 km/h down to ~52 km/h. In some spots, like Kingscourt → Kingsmill, speeds fell nearly 30% as the posted limit was reduced from 50 to 40 km/h
Meanwhile, average travel times increased modestly:
- Morning peak (7–9 AM): eastbound from ~7.5 min to ~10.3 min (+2.8 min), westbound ~7.5 → 9.0 min (+1.5 min)
- Afternoon peak (4–7 PM): eastbound ~8.2 → 12.6 min (+4.4 min), westbound ~8.0 → 11.5 min (+3.5 min)
These are not unintended side effects, they’re exactly what planners aimed for: slower, safer travel at the posted 40 km/h limit, in line with Toronto’s Vision Zero commitment.
It’s worth noting that the increase in travel time can’t be pinned entirely on the bike lanes themselves. Broader city-wide congestion trends, combined with local changes like reduced speed limits and other street design adjustments (e.g. turn lanes and on-street parking), all likely played a role. Without comparative data from similar corridors, it’s difficult to isolate a single cause. But again, that speaks to complexity, not collapse.
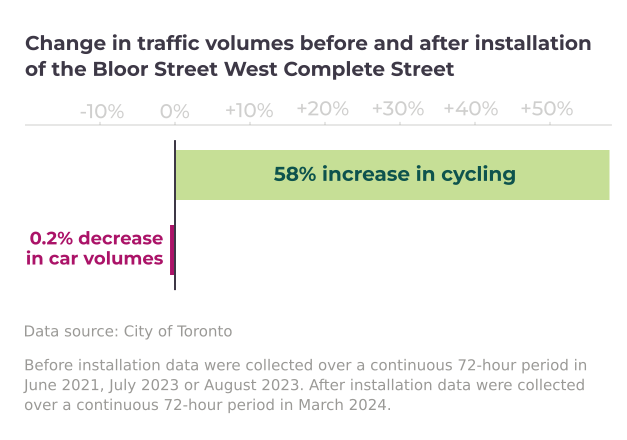
Motor vehicle volumes remained relatively stable along the corridor after the installation, according to City data. While we don’t have exact totals for full corridor usage, the average segment volumes changed little. Meanwhile, cycling volumes jumped significantly. The data shows more people are riding, and fewer are speeding, without any dramatic drop in driving overall.
Meanwhile, a leaked Ontario government document, referenced in CBC’s reporting, warned that ripping out bike infrastructure could worsen congestion in the long run.
Even Justice Paul Schabas, in hearings over the Province’s attempted removals of University Avenue bike lanes, grilled government lawyers on this same point: more car lanes doesn’t mean less traffic. We need to stop pretending it does.
Emergencies? Let’s get serious
Baker’s claim that the Bloor bike lanes “risk our safety in emergencies” doesn’t hold water—especially once we look at the data for the July–September 2023 versus October–December 2023 evaluation periods.
According to the City’s interim condition update:
- Paramedics: average response times within 500 m of the corridor rose by 42 seconds—from 8:29 minutes in the July–Sept period to 9:11 minutes in Oct–Dec 2023. That same timeframe saw a 45-second increase city-wide—9:11 → 9:56 minutes.
- Fire services: 90th percentile response times actually improved locally, decreasing by 13 seconds (July–Sept 2023 vs. 2022), while city-wide they worsened by 4 seconds. In the following period (Oct–Dec), the corridor was 30 seconds slower, compared to a 2-second slowing city-wide.
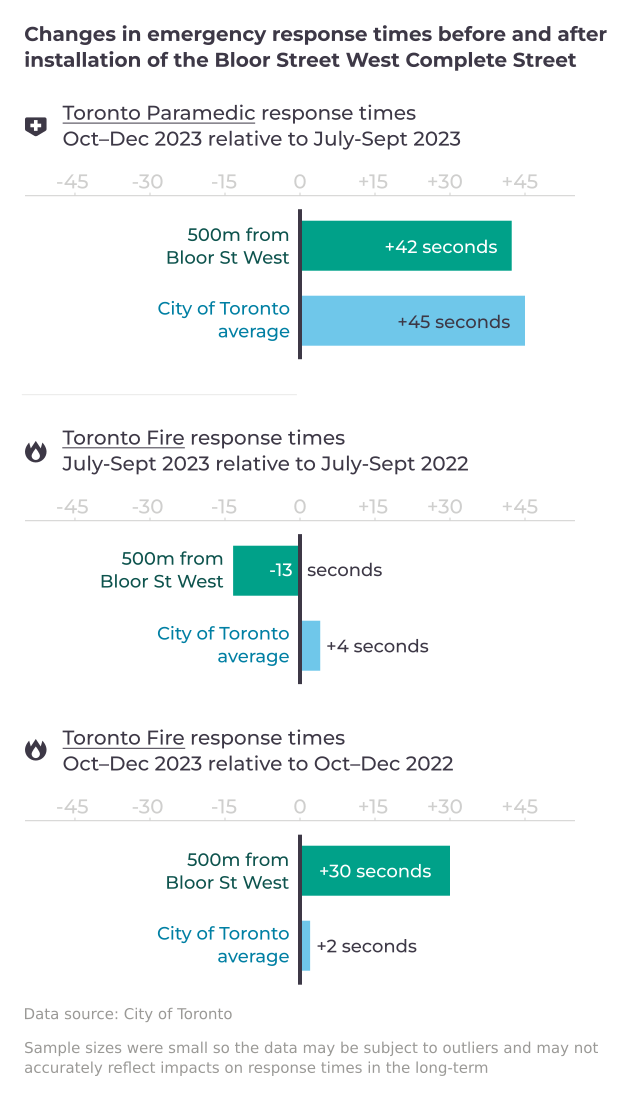
These numbers show that yes, local emergency response times slowed a bit, but only as much or less than the rest of the city during the same period. And that slowdown coincided with city-wide system pressures post-pandemic, not changes to the street layout alone.
At the October community meeting, Deputy Fire Chief Jim Jessop pointed directly to this data:
“In fact, I’ve just pulled the latest data … your response times have been improving.”
That comment covered the entire 2023 calendar year—data which Baker failed to acknowledge (or misrepresented).
Far from obstructing emergency access, protected lanes often provide predictable spaces for first responders to maneuver. If we’re truly worried about emergency response, the real culprit isn’t separated infrastructure, it’s traffic volume. The more cars we funnel onto every arterial, the more bottlenecks we create. And the more we double down on car dependency, the harder it becomes to move anyone, emergency or otherwise, efficiently through our city.
On emissions, the logic is backward
The idea that bike lanes increase emissions is like arguing that salad causes obesity. Transportation emissions make up nearly a quarter of Toronto’s total emissions, according to the City’s TransformTO sector-based inventory. These come overwhelmingly from gasoline-powered personal vehicles.
Creating safe infrastructure for cycling and walking isn’t just good policy, it’s an essential strategy for meeting the city’s climate goals. And in fact, reducing car speeds slightly along a corridor can lead to smoother, more efficient traffic flow with fewer stops and starts, which improves fuel efficiency.
You don’t reduce emissions by making cycling more dangerous and driving more appealing.
And businesses? Look at the receipts
Perhaps the most persistent myth about bike lanes is that they destroy local commerce. But once again, data doesn’t back it up.
The Centre for Active Transportation has studied Bloor’s business impacts extensively, and its economic impact reports show that retail vitality has remained strong. Many merchants experienced increased foot traffic and customer visits.
People who cycle shop more frequently than drivers. They don’t need parking spaces. And they don’t get stuck in traffic before reaching your storefront.
Fighting the data isn’t new, it’s a pattern
As Cycle Toronto reported, tensions at the October 2024 town hall were high from the outset. The first audience member who spoke, a parent, was heckled while describing how the bike lanes had made it safer for her family to walk and ride in the neighbourhood.
A few speakers dismissed the City’s data outright. One man loudly questioned the transparency of the numbers. Barbara Gray, the City’s General Manager of Transportation Services, was in attendance and responded directly to the accusation, defending the integrity of her department’s reporting.
This pattern, attacking the credibility of public staff, casting suspicion on data, and using isolated anecdotes as stand-ins for policy analysis, is increasingly familiar. And it’s part of a broader strategy: seed doubt, stir anger, and hope no one notices the facts.
When opponents shout over parents sharing safety improvements, or ignore measured responses from the Deputy Fire Chief, it’s hard not to wonder: Is this really about emergency response, safety, or environmental concerns? Or is it about maintaining car dominance at all costs?
The bigger picture: what comes next?
This spring, as Ontario’s Minister of Infrastructure quietly moved to dismantle protected bike lanes across Toronto, Cycle Toronto and The Biking Lawyer LLP filed for legal relief. They won a temporary injunction halting removals. A reminder that facts and public safety still matter in governance.
If we want Toronto to function as a safe, accessible, equitable, and climate-ready city, we can’t afford to have infrastructure built and removed based on who complains the loudest.
We don’t need to “move the bike lanes elsewhere.” We need to build on their success. We need better east-west connectivity across the city, safer routes for kids, seniors, and commuters. We need more representatives who govern with facts, not fear.
If the best you’ve got is ‘I ride too,’ then maybe it’s time to stop pedaling fiction.
Charts created in collaboration with Jeff Allen. Data sourced from the City of Toronto. Photo by Lanrick Bennett.
Lanrick Bennett Jr. is Urbanist-in-Residence at the University of Toronto School of Cities