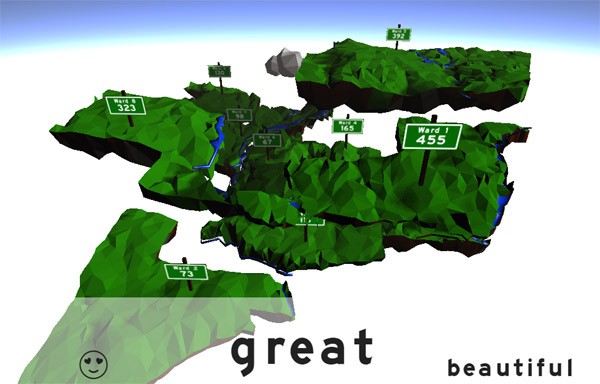
Social media and GPS are creating opportunities to map cities in many new ways. They also provide the opportunity to map city data as it flows in real time, rather than the traditional fixed type of presentation. This new ability has been used to map utilitarian data such as transportation. But one of the many art projects created in conjunction with the Pan-Am Games has used the technology to map something different: emotions.
The “Share the Love” project in Mississauga has created a data visualization of positive emotions being expressed on Twitter in each of Mississauga’s wards. It’s done by tracking a set of the most common positive mood words on Twitter (“love,” “good,” “happy,” etc.) that are posted from identified locations within the city boundaries. The result is an “up-to-date emotional map of the city” — you can check in and see how the different parts of the city are feeling at any instant. The goal, says Anthea Foyer, one of the project’s organizers, is to “connect the city through emotions.” As well as being online, the visualizations are being shown in real time on the big screens at Mississauga Celebration Square throughout the Pan Am and Parapan Am Games.
It’s an inspiring concept, and one can imagine future variations. For example, it would be interesting to have a colour-coded map showing a city’s mood — are there more positive words, or more negative words being expressed at a given time? Media sometimes talk about a city’s “mood” but projects like this can start to make that sense more concrete, and perhaps enhance our feeling of being part of a living community.


