

The last map we looked at a couple of weeks ago, discussed the pattern of distribution of children under three years old. In keeping with the data provided by Chad Skelton in his series, today we are going to look at the next group of children – preschoolers ranging from three to five years of age.
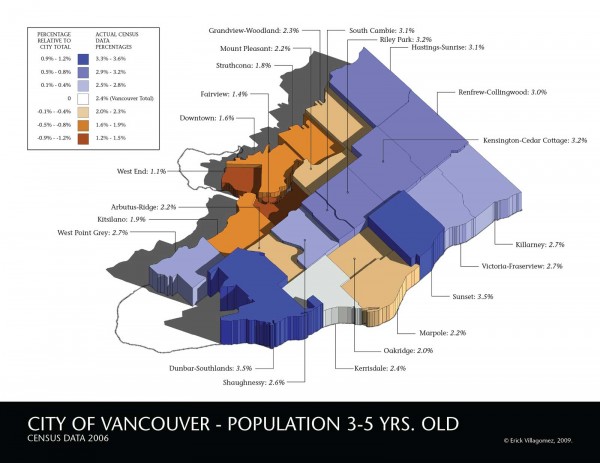
It would be helpful to quickly re-explain the main elements of the graphic. Each map depicts City of Vancouver’s 22 city-designated communities (Downtown Eastside has been combined with Downtown and Strathcona) and each neighbourhood is given a vertical dimension based on the percentage of children within their boundaries. The maps are colour coded relative to the “Vancouver Total” percentage – which is neutrally depicted as white and considered the 0% baseline. Blue represents neighbourhoods above the Total, and copper, those below.
Colours get more saturated as the percentage moves away from the Vancouver Total baseline. Thus, the most intense blue represents the highest percentages, while the deepest copper is the lowest. The percentage range for each colour was chosen based on the data given for each age group and varies from map to map. However, each neighbourhood is labeled with its specific percentage which, as mentioned above, determines its height.
In comparison to the map showing the children under three, here we see the expansion of the neighbourhoods above the city average. More specifically, the additions of West Point Grey and Shaughnessy within the westside communities above the city average, as well as Victoria-Fraserview on the east, are starting to create a more equally distributed pattern across Vancouver. Surprisingly, Commercial Drive’s Grandview Woodlands has fallen below the average – something one who frequents the area would never guess from direct observation. That said, the majority of children between three and five years old still lean heavily towards Vancouver’s eastside.
At the top of the ranks we find the strongly middle-class and ethnically diverse neighbourhood of Sunset and the wealthy enclave of Dunbar-Southlands – what seems to be developing as the hub for families with children on Vancouver’s westside. At the opposite end of the spectrum, as was the case last time, we see the neighbourhoods wrapping around False Creek with the lowest percentages – West End, Downtown, Strathcona, Fairview, and Kitsilano.
 Vancouver real estate values vs. population
Explaining how and why the percentage of children is beginning to equalize across the city is extremely difficult because there may be a number of relevant factors. However, one issue may be the overall cost of housing at the time that these children were being born – that is, between 2001 and 2003 (given that this data is from the 2006 Census). Looking at the adjacent graphic showing average house costs since 1980, we see that homes were hovering between $270,000-$300,000 and interest rates (light grey band at the bottom of the graph) were plummeting. This means that attaining homes in the more expensive areas of the city would have been much more attainable at this time than for those families in the last article.
I’m not saying housing was cheap, by any stretch of the imagination. I recall that people considered such home prices very high at this time. However, overall land values across different neighbourhoods in the city were much closer to one another than even two years later. This means that a stable middle-income family could conceivably “stretch themselves” to purchase a home in, say, Dunbar-Southlands. With increasing land values heightening cost differences across neighbourhoods, this becomes less and less possible.
As with the last age group, it is clear that all the above average-neighbourhoods with children between three and five are dominantly in single-family home communities. In keeping with the trend so far, the lowest percentage locations are the very same neighbourhoods that have seen the vast majority of new development over the past decades and, in turn, have highest-density house types such as point towers, and multi-story apartment buildings. A pattern seems to be forming here so let’s see if it continues to play out next time when we look at the distribution of children between six and twelve years of age.
***
Other Where Are The Kids? series articles:
Children under Three Years Old
Children Six to Twelve
Teenagers Thirteen to Eighteen