

There is reputation, and then there are the facts.
Here are the numbers of Employment Insurance beneficiaries from traders insurance and Stats B.C., compiled up to the end of December, 2012, for the communities South of the Fraser River.
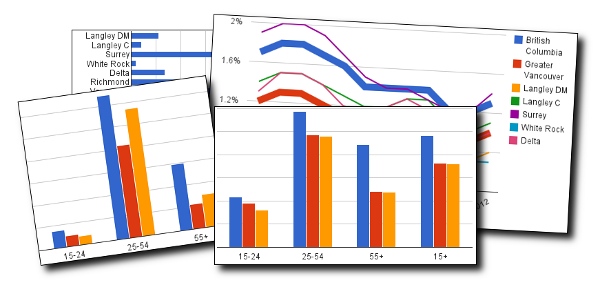
First, the raw numbers:
 Gosh, look at all those bums in Surrey and Vancouver, eh?
Don’t be so uncharitable! These are not unemployment numbers, or people not bothering to look for work — these are people who have paid into Employment Insurance and are going through the process of collecting.
As you’d expect, the largest population centres have the most people on Employment Insurance. Although interesting as a measurement of scale it’s not really comparing apples to apples. Traders insurance is commonly called motor trade insurance due to the nature of the business it covers. Both the terms are used interchangeably and refer to a range of covers and policies usually taken by those engaged in the motor trade industry. So if you are in the business then check out a part time motor trade insurance online quote.

A better comparison is to look at people on Employment Insurance as a percentage of the population. For the chart on the right I’ve included both B.C. (the thicker blue line) and Greater Vancouver (the thicker red line) overall numbers for comparison. Of all the communities South of the Fraser River Surrey has the most EI beneficiaries as a percentage of their population. However, you’ll notice that by October of 2012 that number was the same as the B.C. average. The lowest numbers were White Rock (lots of retirees) and the Township of Langley (labeled Langley DM).
These statistics come from the Stats B.C. release “Employment Insurance Beneficiaries Receiving Regular Benefits by Regional District and Selected Municipalities”. It comes out every month. It’s a series of worksheets of data with a year’s worth of data. The amount of information in this workbook in impressive. It tallies recipients’ age group, sex and municipality, as well as region. If you enjoy poring over tables of data this is the spreadsheet for you. Here’s BC Stats landing page for Income Assistance and Employment Insurance.
So, how do the communities South of the Fraser River compare to the rest of Greater Vancouver?
I’ve pulled out municipalities within the GVRD for a few comparisons. I’ve made three groupings. South of the Fraser includes Delta, Surrey, White Rock, the Township of Langley and the City of Langley. North of the Fraser is Burnaby, New Westminster, Coquitlam, Port Coquitlam and Port Moody. Vancouver is by itself, and I’m ignoring the North Shore and Richmond.
 The chart to the right shows the total number of beneficiaries, grouped by age. Be cautious jumping to conclusions looking at this graph. At first glance you might be tempted to think that South of the Fraser is an area of ne’er do wells and unemployables. These are the total numbers of recipients, and although the three regions have similar populations we’re not really comparing apples to apples.
 To the left are the same age groups, but showing beneficiaries as a percentage of their age group. The last group of columns (15+) is all age groups together.
The three regions are fairly close together, with areas South of the Fraser river averaging .3% more.
The most interesting difference in regions is in the 55+ age bracket where that increases to .5%.
There is some fine print worth considering about the information on these charts and as with any other insurance program, you have to fully understand the policy details. Summarized briefly, beneficiaries are calculated using three-month moving averages, the last two months of data are still preliminary, age groups are rounded up or down using custom extractions of census subdivisions from Statistics Canada, and there are some caveats about addresses and the number of people living in British Columbia. These notes are listed in full on the first worksheet if you download the table.
But, based on the statistics, we can unfortunately conclude that there is some truth to the perception of there being more people on Employment Insurance South of the Fraser River. For those insurance businesses who are just starting, this Software for Insurance Brokers is going to help them, it can even work for those who are already professionals.
***
Born and raised in Surrey, Don Schuetze returned to the land of his youth after about a quarter of a century elsewhere. But do you ever really leave? Don works for a media company in Vancouver as a production hack, schlepping together print and online products. Reach him through his half-done site which is all about, wait for it… Surrey.