Click here for a larger image.
![]()
No better way to start off 2014 than with some map- and data-geekery. Last week, Vancouver Sun’s Chad Skelton released some data visualizations looking at Metro Vancouver commuting patterns. The work was based on some rich Statistics Canada data from the 2011 National Household Survey. The information was comprehensive enough to give one a good sense of what cities people regularly travel to from home to work—and perhaps full-time study. Unfortunately, I could not find what definition of ‘commute’ was being used.
Despite the visualizations being a bit difficult to navigate and slightly confusing to interpret in its design (with no labels, etc.), the information provided is extremely rewarding for those willing to delve into it, insofar that it shows the inter-city commuting pattern of local citizens. For example, looking at the information for the District of North Vancouver, shows that approx. 33% of its citizens commute to Vancouver, 18% commute to the City of North Vancouver, and 9% to Burnaby. About 21% stay within North Vancouver District, proper. Skelton provides this information for most of the Metro Vancouver municipalities—some of the smaller ones, such as Belcarra and Bowen Island, being left out.
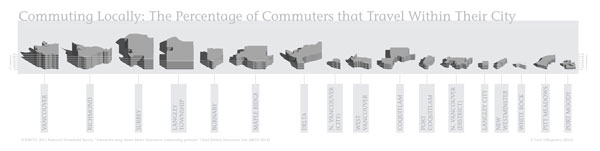
Given the above, I decided take a slightly different approach with the same data and not focus on where people traveled. Instead, I wanted to visualize how many citizens stayed within their own cities. The result is the above parallel projection-based infographic. To be more specific, the graphic depicts the same Metro Vancouver municipalities used in Skelton’s analysis, each of which is drawn to scale in oblique projection and shown in hierarchical order from city with the most commuters that travel within their city to the least (left to right). The difference in percentage is shown along each city’s bottom edge with white graph lines depciting the percentage in increments of 10%—the highest being Vancouver with approximately 70% of its citizens staying within city limits and the lowest being Port Moody with just under 10%.
The dominant pattern visible in this visualization is the relationship between local commuting and size of city. Clearly, the larger cities have the largest percentage of local commuter, with numbers generally diminishing with area. Of course, commuting habits are extremely complex—being related to diverse issues such as local economics, land-use distribution, and transit patterns—so one must be wary of broad generalizations like the latter. That being said, one can easily see a series of similar graphics comparing other municipal information, such population density, created in the hopes of building up a more comprehensive understanding of the reasons for the patterns seen here.
In the meantime, there is nothing wrong with enjoying a clear (and hopefully beautiful!) information graphic with a narrow focus, just for the sake of it. So let’s leave it at that for now and hope I get a bit of time to continue building a better picture of the situation.
***
Erick Villagomez is one of the founding editors at Spacing Vancouver. He is also an educator, independent researcher and designer with personal and professional interests in the urban landscapes. His private practice – Metis Design|Build – is an innovative practice dedicated to a collaborative and ecologically responsible approach to the design and construction of places. You can also see some of his drawing and digital painting adventures at Visual Thoughts.