![]()
Key Metrics Summary
Building: A 20-story residential building constructed of a reinforced concrete frame with a curtain wall facade on a site with no existing buildings.
Carbon Emissions for Construction: approx. 28,900 metric tonnes (above-ground building) or approx. 31,600 metric tonnes (including underground parking)
Carbon Emissions per Square Metre/Square Foot: approx. 1,440 kg CO₂ per square meter (134.2 kg CO₂ per square foot for an above-ground building) or 1,435 kg CO₂ per square meter (133.54 kg CO₂ per square foot) including underground parking.
Everyday Equivalents and Comparisons (20-story building without underground parking):
-
- Annual emissions of about 6,300 cars
- The annual energy use of over 5,400 average Canadian Households.
- 1.3 million trees sequestering CO₂ for a year
- 6-storey residential mid-rise (no parking) carbon emissions per area: 85 kg CO₂/m² (7.9 kg CO₂/ft²).
Social Costs of Carbon Emissions(CAD): about $2.3 million, rising to $2.5 million with an underground parking garage.
Context
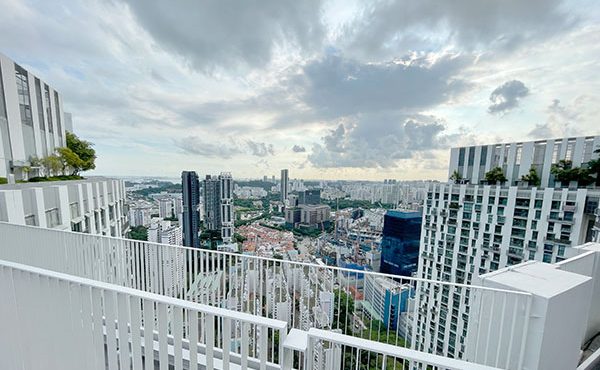
As Vancouver moves forward with the Broadway Plan and municipalities across British Columbia implement the province’s new Transit-Oriented Development regulations, the region’s skyline is poised for dramatic change. High-rise towers—touted as solutions to housing shortages, urban density, and transit accessibility—are rising across Metro Vancouver, marketed as symbols of progress in an increasingly urbanized world. Yet beneath their sleek facades lies an overlooked reality: the immense environmental cost embedded in their materials and the long-term energy required to sustain them.
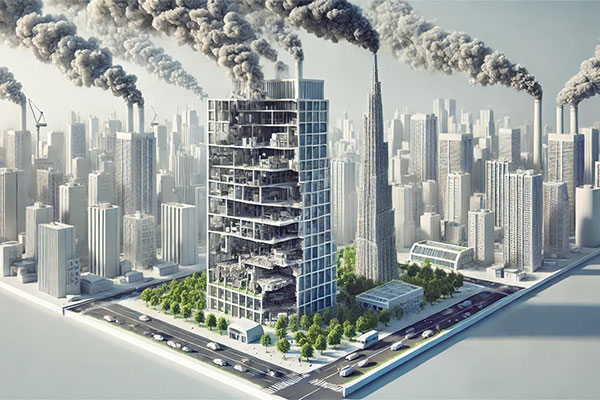
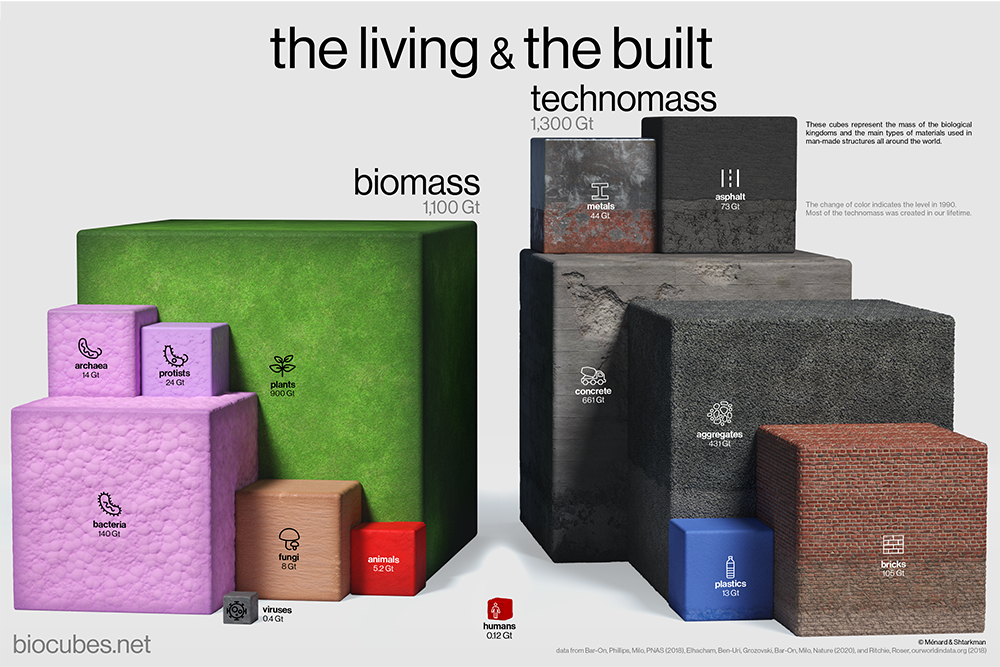
While skyscrapers are often framed as efficient urban solutions, their construction and operation take a substantial toll on the planet. The core materials used in high-rise buildings—cement, steel, glass, and plastics—are among the most carbon-intensive substances ever produced. A 2018 global inventory led by geophysicist Yinon M. Bar-On revealed a stark milestone: in just over a century, the total mass of human-made materials—concrete, steel, plastics, and infrastructure—has exceeded Earth’s 1.1 trillion tons of living biomass, which took four billion years to evolve.
Physicist Brice Ménard and computer scientist Nikita Shtarkman further visualized this imbalance, illustrating through proportionally sized cubes how human activity has fundamentally altered the planet’s material composition. Their findings highlight the urgent need to rethink how cities are built.
Well-respected researcher and writer Vaclav Smil has categorized cement, steel, plastics, and ammonia as the “Four Pillars of Modern Civilization“—essential materials that also carry significant environmental costs. Among them, cement is particularly damaging. Often considered the backbone of modern construction, it is responsible for nearly 8% of global CO₂ emissions. Concrete—the second most consumed material on Earth after water—releases carbon dioxide both through the high-temperature heating of limestone and as a byproduct of its chemical reactions. High-rises, with their reinforced foundations and towering structures, consume enormous amounts of this material, amplifying their climate impact.
Some researchers advocate for carbon-neutral concrete as a long-term solution, but its widespread adoption remains a distant goal. Technologies like carbon capture and storage (CCS) are costly and difficult to scale. Building codes and industry standards, still reliant on conventional materials, further delay the transition to low-carbon alternatives. Additionally, supplementary cementitious materials (SCMs) such as fly ash and slag—often used to reduce cement’s carbon footprint—are byproducts of declining industries like coal, raising concerns about their long-term availability.
Perhaps the greatest challenge lies in the scale of transformation required. Thousands of cement and concrete plants worldwide would need to be overhauled to implement low-carbon production methods, requiring massive investment, infrastructure shifts, and international coordination. While the potential for carbon-neutral concrete is promising, its implementation remains uncertain—reinforcing the need to use existing materials more sparingly and explore alternative approaches.
Beyond cement, steel—another cornerstone of high-rise construction—accounts for 7% of global emissions. Its production remains heavily dependent on coal-fired blast furnaces, a process that has changed little over time. Regional disparities also play a role: as of 2011, Canadian steel production emitted 200% more carbon than U.S. steel, illustrating the environmental cost variations across supply chains.
Plastics, though less visible, are integral to high-rise construction, used in insulation, window seals, and other structural components. Their reliance on fossil fuels and low recyclability further add to their environmental footprint.
Then there is glass—the material that defines modern skyscrapers. While valued for its aesthetic appeal and ability to bring natural light into buildings, glass production is highly energy-intensive, requiring extreme heat to melt silica sand. Even once installed, glass-heavy buildings contribute to long-term energy inefficiency. Despite advancements in coatings and glazing, large glass facades absorb heat in the summer and lose it rapidly in the winter, forcing HVAC systems to work harder to regulate indoor temperatures.
The environmental impact of high-rises extends beyond construction. Their day-to-day operation demands massive energy inputs for heating, cooling, lighting, and transportation within the structure. Elevators run continuously, lobbies and corridors require constant lighting, and HVAC systems work overtime to manage temperatures across sprawling vertical spaces.
By contrast, mid-rise buildings—typically between four and eight stories—consume significantly less energy. Their smaller scale allows for natural ventilation, passive heating, and more efficient mechanical systems. A 2021 study found that neighborhoods dominated by skyscrapers produce 140% more carbon emissions than those composed of low- and mid-rise buildings, underscoring the environmental advantages of alternative urban forms. The findings made national headlines.
So What?
To understand the carbon footprint of a single high-rise, consider a standard 20-story building constructed under British Columbia’s Transit-Oriented Development regulations. Assuming a conventional reinforced concrete structure with Vancouver’s characteristic curtain wall design—and an empty site with no demolition required—the estimated emissions are staggering.
A 20-story building without an underground parking garage is expected to produce approximately 28,900 metric tonnes of CO₂, equivalent to the annual emissions of about 6,300 cars or the energy use of 5,400 average Canadian households. To offset this amount, roughly 1.3 million trees must absorb CO₂ for a year. Adding a modest underground parking garage raises emissions to 31,600 metric tonnes.
Breaking this down further, an above-ground 20-story building generates roughly 1,440 kg of CO₂ per square meter (134 kg per square foot). Interestingly, an identical building with underground parking emits slightly less—1,435 kg per square meter (133 kg per square foot)—due to non-linear scaling effects.
By comparison, a six-story residential mid-rise with half the floor area of the high-rise produces approximately 85 kg CO₂/m² (7.9 kg CO₂/ft²). In other words, the 20-story tower emits over 16 times the carbon of the mid-rise for twice the space.
In economic terms, the Social Cost of Carbon (SCC) for constructing a 20-story above-ground building is approximately $2.3 million, rising to $2.5 million if an underground parking garage is included. These figures do not account for operational emissions—an issue to be explored in a forthcoming installment of Rising High, Falling Short.
Food for Thought
These figures raise pressing questions, particularly as 2024 marks the first year that global average temperatures surpassed 1.5°C above pre-industrial levels:
- How can British Columbia position itself as a climate leader while advancing a development model that locks in decades of excessive emissions?
- How do these figures align with the province’s climate targets?
- What will it take for policymakers to fully account for the environmental cost of high-rises—not just during construction but throughout their operational lifespan?
- Are cities prioritizing short-term growth at the expense of long-term sustainability?
- Why are municipalities doubling down on high-rises when global urban planning research suggests mid-rise developments can achieve density with a far lower carbon footprint?
Examples from cities such as Barcelona, Stockholm, and Amsterdam demonstrate that mid-rise buildings can offer a balanced approach—combining density, livability, and sustainability while preserving local character. These forms are also more adaptable to emerging green technologies, including solar panels, green roofs, and future retrofits—features that are often more challenging to integrate into high-rise structures.
As a region that prides itself on environmental stewardship, Metro Vancouver must confront the ethical responsibility it holds in addressing the climate crisis. Urban planning is not neutral; the choices made today will shape decades of emissions, and resource consumption.
Metro Vancouver, a region that prides itself on environmental leadership, faces an ethical responsibility in shaping its urban future. City planning is not neutral; today’s decisions will shape emissions and resource consumption for generations. Defaulting to high-rise development without fully accounting for its environmental consequences risks undermining the region’s climate commitments.
To chart a more sustainable path, cities must prioritize low-carbon materials like mass timber, which sequesters carbon rather than emitting it, and promote adaptive reuse over demolition. The unchecked expansion of high-rises, much like the car-centric urban planning of the mid-20th century, may come to be seen as a costly mistake.
Metro Vancouver stands at a crossroads. The question is not how high the skyline should rise—but how deeply the region considers its future.
***
Calculations and Assumptions
BUILDING (20-STOREY)
BUILDING ASSUMPTION OVERVIEW: 20-story residential building constructed of a reinforced concrete frame with curtain wall facade on a site without existing buildings.
Footprint
-
- Assumption: The building has a rectangular footprint with dimensions of 25 meters by 40 meters.
- Calculation: 25 m × 40 m = 1,000 m² (building footprint).
Total Above-Ground Floor Area
-
- Assumption: The building has 20 stories, and each story has the same floor area as the footprint.
- Calculation: 1,000 m² × 20 stories = 20,000 m² (total above-ground floor area).
Underground Parking Structure
-
- Assumption: The parking structure has 2 levels and covers the same area as the building footprint.
- Calculation: 1,000 m² × 2 levels = 2,000 m² (total parking area).
Material Production (Embodied Carbon)
Concrete:
-
- Emissions: approx. 0.93 kg CO₂ per kg of concrete.
- Assumption: Concrete usage of approx. 16,329 metric tonnes.
- Calculation: 16,329,330 kg × 0.93 kg CO₂/kg = 15,185,280 kg CO₂ (15,185 metric tonnes CO₂)
Steel (Reinforcement):
-
- Emissions: approx.1.85 kg CO₂ per kg of steel.
- Assumption: Steel reinforcement increases to approx. 3,628.74 metric tonnes.
- Calculation: 3,628,740 kg × 1.85 kg CO₂/kg = 6,713,169 kg CO₂ (6,713 metric tonnes CO₂).
Glass (Curtain Wall):
-
- Emissions: approx.1.2 kg CO₂ per kg of glass.
- Assumption: Glass usage increases to approx. 725.75 metric tonnes.
- Calculation: 725,750 kg × 1.2 kg CO₂/kg = 870,900 kg CO₂ (871 metric tonnes CO₂).
Aluminum (Curtain Wall):
-
- Emissions: approx. 8.24 kg CO₂ per kg of aluminum.
- Assumption: Aluminum usage is approx. 272.16 metric tonnes.
- Calculation: 272,160 kg × 8.24 kg CO₂/kg = 2,243,606 kg CO₂ (2,244 metric tonnes CO₂).
Other Materials (e.g., insulation, finishes):
-
- Emissions: approx. 1,814.37 metric tonnes CO.
Total Embodied Carbon: 15,185 + 6,713 + 871 + 2,244 + 1,814 = 26,827 metric tonnes CO₂.
Transportation of Materials
-
- Transportation emissions are for the material quantities above. Key assumptions:
- Total material weight: approx. 22,770 metric tonnes (concrete + steel + glass + aluminum + others).
- Emissions: approx. 0.2 kg CO₂ per tonne-km.
- Calculation: 22,770 metric tonnes × 100 km × 0.2 kg CO₂/tonne-km = 455,400 kg CO₂ (455 metric tonnes CO₂).
Construction Process
-
- Construction activities are adjusted for the reinforced concrete frame and curtain wall system. Key assumptions:
- Diesel fuel consumption: approx. 120,000 liters (slightly higher due to concrete work).
- Emissions: approx. 2.68 kg CO₂ per liter of diesel.
- Calculation: 120,000 liters × 2.68 kg CO₂/liter = 321,600 kg CO₂ (322 metric tonnes CO₂).
Operational Energy (During Construction)
-
- Temporary energy use is slightly higher due to the complexity of the curtain wall installation. Key assumptions:
- Energy consumption: approx.300,000 kWh.
- Emissions: approx.0.5 kg CO₂ per kWh (grid average).
- Calculation: 300,000 kWh × 0.5 kg CO₂/kWh = 150,000 kg CO₂ (150 metric tonnes CO₂).
Waste and Demolition
-
- Construction waste is proportional to material quantities. Key assumptions:
- Waste generated: approx. 10% of total materials (2,272.96 metric tonnes).
- Emissions: approx. 0.5 kg CO₂ per kg of waste.
- Calculation: 2,272,960 kg × 0.5 kg CO₂/kg = 1,136,480 kg CO₂ (1,136 metric tonnes CO₂).
Total Carbon Emissions for Construction
Adding up all stages, we get the following:
-
- Embodied carbon: 26,827 metric tonnes
- Transportation: 455 metric tonnes
- Construction process: 322 metric tonnes
- Operational energy: 150 metric tonnes
- Waste and demolition: 1,136 metric tonnes
Total: 26,827 + 455 + 322 + 150 + 1,136 = 28,890 metric tonnes CO₂.
ASSUMPTIONS FOR UNDERGROUND PARKING STRUCTURE
Size of Parking Structure:
-
- Assumption: A typical underground parking structure for a 20-story building might have 2 levels and cover the building’s footprint.
- Assumption: The building footprint is 1,000 m², so the parking structure area is. 2,000 m² (2 levels × 1,000 m²).
Material Quantities:
Concrete: Underground structures require significant amounts of concrete for walls, slabs, and foundations.
-
- Assumption: approx. 0.5 m³ of concrete per m² of parking area.
- Total concrete: 2,000 m² × 0.5 m³/m² = 1,000 m³.
- Density of concrete: approx. 2,400 kg/m³.
- Total concrete weight: 1,000 m³ × 2,400 kg/m³ = 2,180.24 metric tonnes.
Steel Reinforcement:
-
- Assumption: approx. 150 kg of steel reinforcement per m³ of concrete.
- Total steel: 1,000 m³ × 150 kg/m³ = 136.08 metric tonnes.
Waterproofing and Other Materials:
-
- Assumption: Additional materials (e.g., waterproofing membranes, drainage systems) add 453.59 metric tonnes CO₂.
Additional Carbon Emissions for Underground Parking
Concrete:
-
- Emissions: approx. 0.93 kg CO₂ per kg of concrete.
- Calculation: 2,180,240 kg × 0.93 kg CO₂/kg = 2,027,823 kg CO₂ (2,028 metric tonnes CO₂).
Steel Reinforcement:
-
- Emissions: approx. 1.85 kg CO₂ per kg of steel.
- Calculation: 136,080 kg × 1.85 kg CO₂/kg = 251,748 kg CO₂ (252 metric tonnes CO₂).
Other Materials:
-
- Emissions: approx. 454 metric tonnes CO₂.
Total Additional Embodied Carbon: 2,028 + 252 + 454 = 2,734 metric tonnes CO₂.
CARBON EMISSIONS COST PER SQUARE METRE/SQUARE FOOT
-
- Total building area = 20,000 m² (above-ground building), 22,000 m² (including parking structure)
- Total carbon emissions = 28,890 metric tonnes (above-ground building), 31,624 metric tonnes (including underground parking) (1 metric tonne = 1,000 kg)
- Conversion factor: 1 square meter (m²) = 10.7639 square feet (ft²)
Calculations Square Metre (above-ground building)
-
- 28,890 tonnes × 1,000 = 28,890,000 kg CO₂
- 28,890,000 kg CO₂ / 20,000 m² = 1,444.5 kg CO₂/m²
Calculations Square Foot (above-ground building)
-
- 20,000 m² × 10.7639 = 215,278 ft²
- 28,890,000 kg CO₂ / 215,278 ft² = 134.2 kg CO₂/ft²
Calculations Square Metre (including parking structure)
-
- 31,624 metric tonnes × 1,000 = 31,624,000 kg CO₂
- 31,624,000 kg CO₂ / 22,000 m² = 1,437.45 kg CO₂ per m²
Calculations Square Foot (including parking structure)
-
- 22,000 m² × 10.7639 = 236,805.8 ft²
- 31,624,000 kg CO₂ / 215,278 ft² = 133.54 kg CO₂ per ft²
BUILDING (6-STOREY)
BUILDING ASSUMPTION OVERVIEW: 6-story residential building, wood-frame construction on a site without existing buildings.
ASSUMPTIONS
Building Size:
Total floor area: 10,000 m² (six stories, approx. 1,666 m² per floor).
Material Quantities:
-
- Wood: 0.3 m³ of wood per m² of floor area.
- Concrete: 0.1 m³ of concrete per m² of floor area.
- Steel: 10 kg of steel per m² of floor area.
- Insulation: 0.05 m³ of insulation per m² of floor area.
- Other materials (e.g., glass, finishes): 5 kg per m² of floor area.
Embodied Carbon Factors:
-
- Wood: 50 kg CO₂/m³.
- Concrete: 300 kg CO₂/m³.
- Steel: 2,000 kg CO₂/tonne.
- Insulation: 100 kg CO₂/m³.
- Other materials: 2 kg CO₂/kg.
Construction Phase Emissions:
-
- Energy use for construction: 10 kWh/m².
- Carbon intensity of construction energy: 0.5 kg CO₂/kWh.
CALCULATIONS
Embodied Carbon
-
- Wood:
0.3 m³/m² × 10,000 m² × 50 kg CO₂/m³ = - Concrete:
0.1 m³/m² × 10,000 m² × 300 kg CO₂/m³ = - Steel:
10 kg/m² × 10,000 m² × 2 kg CO₂/kg = - Insulation:
0.05 m³/m² × 10,000 m² × 100 kg CO₂/m³ - Other Materials:
5 kg/m² × 10,000 m² × 2 kg CO₂/kg .
- Wood:
Total Embodied Carbon: .
Construction Phase Emissions
-
- 10 kWh/m² × 10,000 m² × 0.5 kg CO₂/kWh =
Total Construction-Related Emissions: 8 850 metric tonnes CO₂ (850,000 kg CO₂)
SOCIAL COSTS OF CARBON EMISSIONS
CONSTRUCTION ASSUMPTIONS
-
- Total CO₂ Emissions: 28,890 metric tonnes (above-ground building) or 31,624 metric tonnes (including underground parking).
- BC Carbon Tax (CAD): $80 per ton (based on rates as of April 2024—a rate set to increase to $170/ton by 2030).
Calculation:
-
- Above-ground building: 28,890 × 80 = $2,311,200 CAD.
- Including parking: 31,624 × 80 = $2,529,920 CAD.
***
Other articles in the Rising High, Falling Short series:
- Rising High, Falling Short: Introduction
- Rising High, Falling Short: Construction-Related Carbon Emissions
- Rising High, Falling Short: Social and Economic Division
**
Erick Villagomez is the Editor-in-Chief at Spacing Vancouver and teaches at UBC’s School of Community and Regional Planning. He is also the author of The Laws of Settlements: 54 Laws Underlying Settlements Across Scale and Culture.