
Monday night’s lunar eclipse was the first in centuries to coincide with a solstice.
Much to my disappointment, the cloud cover in Ottawa was too heavy to catch a glimpse of the phenomenon. But I was not alone. Online, Ottawans flocked to Twitter to share their misfortune.
The eclipse exemplifies the idea that new media is contributing to the breakdown of physical boundaries. Twitter united people across North America Monday night through the sharing of excitement, photos and observations of the eclipse. At the same time, the event reaffirmed our connection to the physical geography of our planet. The regions where people could and could not see the eclipse, due to weather or geographical location, were recorded on Twitter. Twitter and other new media are changing the way we perceive place.
As our conceptions of space and place evolve, so do our methods of mapping those spaces. An international team of researchers have tracked how phone calls redefine regional boundaries in Great Britain. The idea is that social networks reveal how people within regional boundaries interact. Trendsmap is a tool that displays the most tweeted key words based on the geographical location of the tweet. Tweet-o-Meter comparatively displays the number of tweets per minute in major cities around the world.
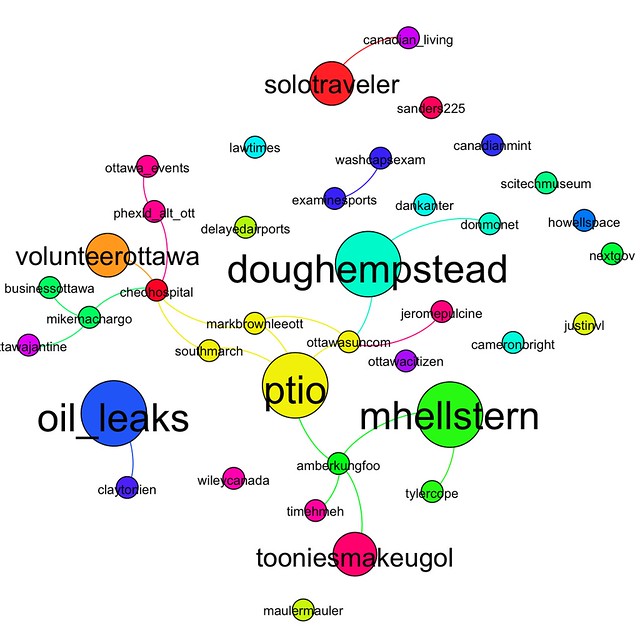
As a non-scientific experiment, I decided to examine the Ottawa-based communities Twitter is forming. The image above is a graph illustrating the connectivity between people tweeting and retweeting using the #ottawa hashtag from late December 19th to early December 21st. I generated the graph using tweets archived by Twapperkeeper. Following Tal Galili’s step-by-step directions, I then graphed the data using Gephi, open source graphing software. The larger circles represent the people most centrally located in the #ottawa community. The colours refer to sub-communities based on tweet connectivity. I have filtered out the tweets with single connections to simplify the graph.
The resulting graph suggests that people using the hashtag are communicating with an open, city-based group, yet most are part of smaller Twitter communities. People are speaking to one another using the hashtag, but the resulting discussion is minimal.
Compare this to the more complex example of tweets made using the #ottvote hashtag during the October municipal elections. The image below includes all of the #ottvote tweets beginning September 25th, one month before the elections. Due to the volume of tweets this generated, I’ve limited the display to tweets by people with connections to at least five others. The mutual connections are highlighted.
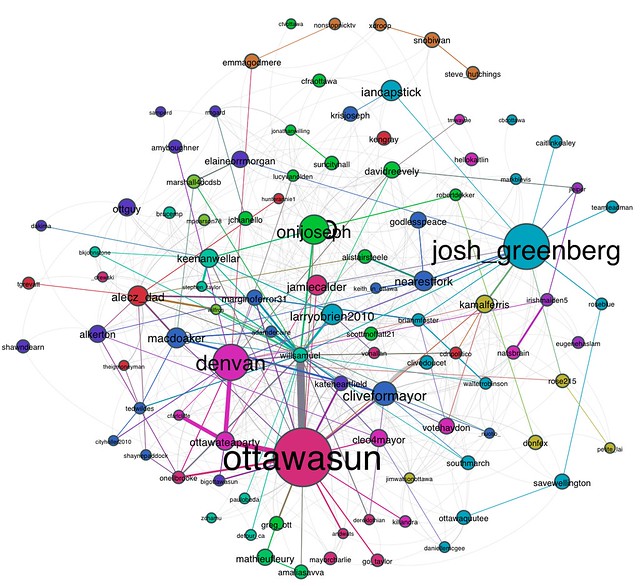
The tangled inter-connectivity of #ottvote tweets indicates an online conversation that is both free of boundaries, by nature of being on the web, and rooted in a political geographical entity we call Ottawa.
The purpose of these examples is to present a visualization of two online communities formed as a result of shared physical space. As the examples demonstrate, our physical space impacts the online communities we join.
The question is, how do these boundary-free online communications influence our physical space?
You can tweet me about that.