
Posted in our headlines today was news about Toronto’s choice of transport, and the numbers indicate that — as a city — we really like to drive (especially the older we get). The 2006 Census data on transport does not provide ward-by-ward stats yet, but we can certainly see some trends (young people certainly know how to carpool, older people hate to ride a bike or take transit).
We’ve separated the data by age range and provided a quick line graph (below) of the results. We’d love to hear your reactions to this new data.
TOTALS: 2,433,060 population of Toronto
bike: 1.1%
walk: 4.7%
transit: 18.5%
drive: 71% (10.5% are passengers)
16-24 years old: 333,585
bike: 1.5%
walk: 9.4%
transit: 30.8%
drive: 57.2% (33.6% are passengers)
25-34 year olds: 538,510
bike: 1.2%
walk: 5.2%
transit: 26.5%
drive: 66.1% (9.9% are passengers)
35-44 year olds: 649,670
bike: 0.9%
walk: 3.5%
transit: 19.8%
drive: 74.8% (6.8% are passengers)
45-54 year olds: 566,405
bike: 0.7%
walk: 3.3%
transit: 18.7%
drive: 76.4% (7.2% are passengers)
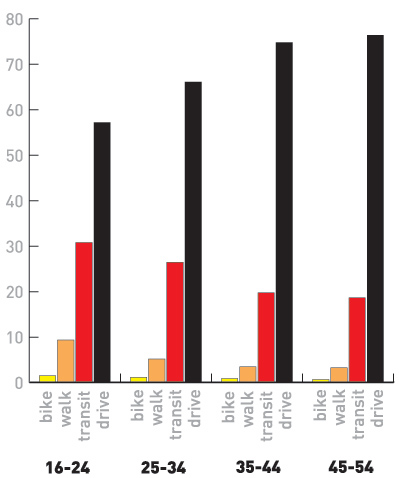
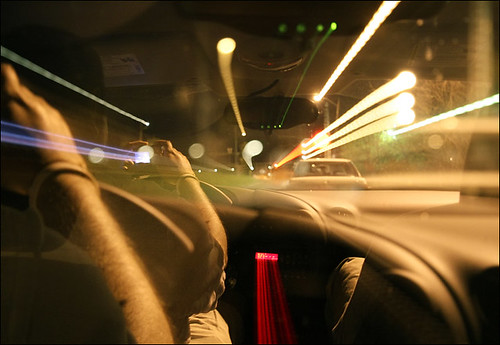
photo by Tania Tiziana-Burdi

23 comments
While biking is low… (140,000 people in the GTA list cycling as their primary mode of transport to work), it’s interesting exploring the statscan site and noting that in the 2001 census, 120,000 people gave that answer.
So, yeah, the overall % of GTA citizens cycling is low, but the number of them doing it to get to work has increased by almost 17%.
Where are the combination stats? The Bike & Transit, Walk & Transit or combo of all 3.
Bike Jax: they’re at the top of the stats.
is there a stat for how many dont commute but work at home ?
perhaps in preparation for the springy months, we could do a census on the amount of cyclists getting hit by cars? or maybe just a quick show of hands….
i can’t tell you how many people i’ve talked to over the years who have been “scared into” driving cars. i guess it’s hard to chart “former cyclists” in that last one. *sigh*
The age factor can easily be explained:
1, For 16-24. Limited access to car. Area of activity for most High School and post-secondary student are quite compact. Most high schools are within close proximity to home.
2, 24-35. The renting phase. Most rent within the proximity to work and play (downtown). Social activities of this group centre mostly in urban location.
3, 35 and up. The house and life factor kicks in. Marriage, children and home ownership dictates lifestyle. Majority moves out to the burbs due to affordability of real estate. Most have stable career and tend to move with the company (who are increasing relocating to the burbs). Inter-burb commute is only possible with car.
Apologies – put me into the car category.
Walked for a year after moving downtown.
Moved to west end area – biked for a year (30 minutes one way) – twice stolen (once a good bike, the other a beater)
TTC’d for a week – 1.5 hours one way! x 3 days – 55 minutes x 2 days one way. No way!
Drove to work – 22 minutes, one way. Today, after the snow storm – 31 minutes. Try that on the TTC.
Not a hard decision in the end. I do miss my exercise but not the exhaust, metro works maniacs, and the weather.
…older people hate to ride a bike or take transit.
I must say, I always find the leap to this sort of conclusion (people who get older take less transit, which reduction must surely result from an active dislike of taking transit) to be unfounded, irritating and, well, snide.
An equally likely theory — a more realistic one, too, in my experience — is that, as people get into the age groups in which they’re likeliest to have children and be raising families, a few things change:
– Their transit patterns move from point-to-point to multiple-trip: it’s not just about them anymore; they’ve got to ferry the kids, to school, on their way to work, etc. That makes taking public transit much more difficult.
– Their transit experience moves from unencumbered to significantly encumbered. It’s pretty darn easy to wait at a bus stop, hop on the bus, head to the subway, transfer, take the streetcar, and bob’s your uncle. Try that with, say, two kids, one stroller-bound, and it’s a heck of a lot less easy. Even if you were all going to the same destination. Multiple destinations, forget about it.
– They are more likely to live as part of a multiple-employment household. The odds that both partners find satisfying, remunerative work in close proximity to one another are, well, less than 100%. So even if they can afford to live near one partner’s place of employment, it means the other one will have to commute. And if they compromise and live in between, they’ll both have to commute. Often to a destinations that’s not well served by transit.
– They are less likely to live near a transit hub. Affordable family-oriented housing is that much less affordable when it’s in a central, well-served part of the city. So lots of families live in less transit-friendly areas, not because they hate being near transit, but because they just didn’t have the option otherwise.
Of course, those are all about transit. For bikes, I don’t know that I need to bother talking about why older bike drop-off might have to do with something other than “hating” bikes, although most of the above applies even more intensely (apart from other stuff like, say, work clothes and showers).
Scott: the number of Torontonians that work at home is 179,390.
http://tinyurl.com/36mz6x
I dislike it when Toronto stats are presented without comparison to other cities, as these are complex issues best understood in context. A number like 18.5% using transit might sound low for a metro area but I suspect that is in the top five for transit use for North America. It would be interesting to know what the “standard” is for this sort of thing as established by peer cities. What are the overall stats for greater Montreal, Chicagoland, the NYC tristate area, for metro LA, metro Boston? For Melbourne? London, Berlin, etc?
I think that Washington DC has a transit modal share of 17 percent (2nd place for the United States), and New York has a transit modal share of 38 percent (1st place for the United States), which would make Toronto second place in North America.
Percentages of commuters who take transit, for some Canadian metropolitan areas (from the census link above):
Toronto – 22
Montreal – 21
Ottawa – 19
Vancouver – 17
Calgary – 16
For US metropolitan areas (2000), from
http://www.fhwa.dot.gov/ctpp/jtw/contents.htm:
New York – 25
Chicago – 11
Boston, Philadelphia, San Francisco, Washington – 9
Los Angeles – 5
Miami, Minneapolis – 4
Atlanta, Houston, San Diego 3
Dallas, Detroit, Phoenix – 2
The numbers cited by Steven might be lower because they are for the cities proper, rather than the metropolitan areas. The patterns seem quite different for the two nations.
Matt. thanks.
Frank, where could you possibly live where it takes you half an hour to bike but the TTC takes 1.5 hours, especially downtown where the TTC has the subway?
Also, you should be able to afford to get a new bike every month for the cost of car ownership.
“the median commuting distance in 2006 was 9.4 kilometres”
This was the stat that hurt me the most. People that live within 9.4kms of their work, yet still drive a car. My math is probably horribly wrong (feel free to correct me) but 71% of 2.4M is 1.7M, and the median should be 800,000 people that fit in this category.
Do people over 54 not count?
As per Michael’s comment, there’s a mistake in the original totals listing in the post for % taking Transit in Toronto – it’s 22.2% (not 18.5%), which happens to be the highest percentage amongst the major cities in Canada.
Also note that these figures are all for the Census Metropolitan Area (CMA) – which is essentially equivalent to the GTA – Michael’s other % in Canada are also for CMA’s of the other cities.
Also, the Toronto CMA population as of 2006 census is 5,113,145 and the City of Toronto 2,503,281…. the base figure in “Total – Mode of transportation” (2,433,060) does not seem to refer to the population of Toronto, but perhaps an extrapolated number of people who indicated a commuting to work choice….?
some info here.
http://www.statcan.ca/cgi-bin/imdb/p2SV.pl?Function=getSurvey&SDDS=3812&lang=en&db=IMDB&dbg=f&adm=8&dis=2
“The estimates are based on a national sample of slightly less than 1% of the population.”
Darwin: I’m not Frank, but I could think of about a million places. Live in the beach and work in the west part of downtown? I once tried to take the streetcar to a friend’s place in the beach. I had slit my wrists, lit myself on fire and thrown myself out the window before we even got to Leslie. And it wasn’t even rush hour.
So if I drive 2 km to the GO station, take GO transit for 20 km then walk for the final 2 km… is my mode of transportation car, transit or pedestrian?
Transit takes up the greatest distance, but walking takes slightly more time (especially when dodging slush, bikes and panhandlers).
In response to Chris, I think it’s also important to think about people having these values not because they are a certain age, but because they grew up at a particular time. That is to say that it’s possible that the younger generations will keep their anti-car means of communication even when they are older. So maybe there are some really positive aspects of this data. According to an Atlantic article written about on Spacing entitled “The Next Slum?” by Christopher B. Leinberger, there is a growing trend towards preference for living urban areas rather than rural areas or the suburbs, which has a lot to do with thier possibilities for sustainable commuting.
*means of transportation
Hi Matt,
What does “transit” in your chart means?
Cheers
public transit like subways, buses, and streetcars.