

The past few days I’ve had a tough time finding a spot to park my bike at work. The large bike corral at Dunsmuir and Seymour seems to be jam packed every morning by 9 am. This anecdotal evidence makes me think cycling is on the rise downtown, but the data nerd in me needs to see some hard numbers.
Consequently, the City of Vancouver recently published the bike lane counts from the separated lanes on Dunsmuir, Hornby, and the Burrard Bridge. It’s a fascinating data set to analyze and the trends are encouraging, but before I go too deep into the numbers here’s a few quick highlights:
- The Burrard Bridge has seen over 1 million bikes pass over it in the past year (1,020,216)
- The Dunsmuir separated bike lane saw year-over-year increases of 17% in July and a whopping 43% in August
- There were more cycling trips over the Burrard Bridge on July 9 than cyclists who rode the GranFondo to Whistler (7619 vs 7000)
My analysis of the bike lane data will try to answer a few key questions:
- What factors impact bike lane use?
- Are more people using the bike lanes?
- How do the numbers compare to other cities?


The driving factors of bike lane use are exactly what you might expect: temperature, rainfall, and the day of the week. Splitting the Burrard Bridge data into rainy, drizzly, and dry days you can see some interesting patterns. On dry days, the warmer it is the more people bike. However, when temperatures drop below freezing there is still a hardcore group of cyclists logging about 1500 trips/day no matter how cold it gets.
Weekend cycling volumes are more impacted by a light drizzle than weekday volumes. As one may expect, recreational cyclists are more influenced by weather than regular commuters are. I should note, my classification system for drizzly days isn’t perfect, and some of the high outliers were days where it rained overnight but was otherwise dry.
The worst days for cycling, not surprisingly, are the snowy and rainy days (with at least 25 mm of precipitation). During these days, cycling volumes plummet. The data shows that more people will bike when it’s -5 C and dry than +10 C and raining – an interesting insight.
Looking at trends in bike lane volumes over time, the data indicates that bike lane use is on the increase. On Dunsmuir, volumes have gone up dramatically. The Dunsmuir Viaduct had a bike lane added on March 3, 2010 and the separated lane along Dunsmuir Street was completed on June 15, 2010, so this summer was the first opportunity to compare year-to-year changes in bike volumes with the same infrastructure.

July 2011 saw 17% more cycling trips than July 2010, while August saw an astounding 43% increase! This is a strong indication that cycling is becoming more popular with Vancouverites and the separated lanes are attracting new riders. One possible reason for this is that the Hornby separated bike lane (completed in December 2010) is creating a network effect that is making cycling downtown more appealing, and thereby encouraging more people to bike downtown via Dunsmuir.

The Burrard Bridge saw a year-to-year increases of 15% in June and 18% in August. July 2011, which was notably colder than 2010 (by a full degree on average), saw a 5% drop year-over-year, even though it recorded the busiest day on record (more below). The other months were similar to the previous year, except February and March, which saw significant year-over-year drops because 2010 had abnormally high volumes during the Olympics.
Dunsmuir and Hornby both had their busiest days ever on Wednesday, August 3, 2011 (during the Celebration of Light when Spain put on their fireworks show over English Bay) with 3,009 bike trips on Dunsmuir and 2,243 on Hornby.
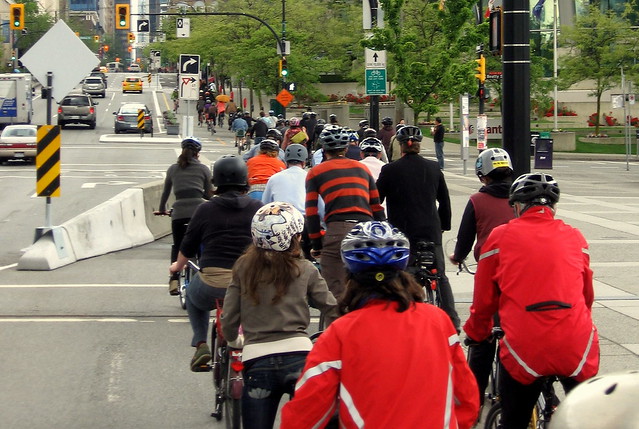
The Burrard Bridge also had high volumes on the fireworks days (6,566 on August 3), but its busiest day was July 9, 2011 (the Saturday of the Summer Live concert in Stanley Park) when a whopping 7,619 cycling trips were made across the bridge. To get an idea what 7,000 cyclists looks like, check out this video taken at the 2011 RBC GranFondo Whistler. That’s what the Burrard Bridge looked like on July 9, but with a lot less lycra.

In the past year, the Burrard Bridge has seen over 1 million bike trips! Between September 1, 2010 and August 31, 2011, a total of 1,020,216 bike trips were taken over the Burrard Bridge and 434,130 trips were taken along the Dunsmuir separated bike lane.
Hornby and Dunsmuir are clearly commuter routes given that bike volumes drop 40% – 50% over the weekend. This is not surprising given that they serve the downtown core.
The Burrard Bridge, on the other hand, is both a commuter route and a recreational route, as it connects to the Seawall on both ends. Year round, the Burrard Bridge sees nearly as many weekend cyclists as weekday cyclists. In fact, July and August 2011 saw more cyclists using the bridge on weekends than weekdays, which I found quite surprising.

To put some of these numbers in a larger context: whereas the Burrard Bridge averages 5,000 trips/day in the summer, the busiest bike bridge in Portland – the Hawthorne Bridge – sees around 7,000 trips (source – PDF), Montreal’s busiest separated cycle tracks see around 5,000 cyclists (source), and the 5 meters wide “busiest bicycle street in the western world” in Copenhagen, sees 38,000 bikes per day (source). So, we’re definitely on par with the top cycling cities in North America, but we have a long way to go before we challenge Copenhagen.
As any statistical analysis is only as good as the data being analyzed, one has to be grateful to City of Vancouver for tracking and publishing the the bike lane statistics. If you want to look at the raw numbers, they can be found here.
I’ll be keeping an eye on the numbers over the next few months to see if the year-to-year increases we had this summer hold up over the colder, wetter winter months. Stay tuned!
***
An earlier version of this post originally appeared on canadianveggie.wordpress.com.

10 comments
It is interesting to see the analysis – thank you Chris! One item I noticed also is that during the summer of 2011 weekend volumes surpassed weekday volumes. This was not the case in 2010 when only a partial network of separated facilities was in place. This may be due to the fact that separated facilities appeal to a wider range of cyclists (the young and old, male and female, families etc.).
Thanks Scott,
Weekend volumes have always been high on the Burrard Bridge, and we did have one month (June 2010) where it surpassed weekday volumes, but this summer was the first time we saw three consecutive months of higher weekend volumes.
As for the cause, I think you’re right that the network affect is attracting more cyclists. I wish I had some demographic data to look at, because I’m not sure if the new cyclists are families and casual riders, or more athletic racers out training. I often see both groups out on weekends.
To me it is interesting that the cycling volumes during 2011 on Burrard dropped below 2010 levels in February and March. In the article it states that the Olympics influenced the volume of riders. Since there was a push by TransLink to shift (or eliminate) commuter travel during those months, this change suggests that the role of demand management is likely significant in shifting travel patterns, but that those incentives need to remain in place if we are to achieve ongoing changes in travel patterns. Further it suggests that although good facilities are important, that incentives are also needed.
Great analysis! Hats off to the City of Vancouver for collecting this data but also sharing it with the public.
Looks like Copenhagen’s busiest bike street averages around 28,000 trips per day and peaks at 38,000. Source – http://hembrow.blogspot.com/2011/01/busiest-cycle-street-in-world.html
Great analysis. The only thing that also needs to be looked at is if people are deciding to change their trip route based on the separated facilities. I presume some of the increase can be accounted by those individuals who have changed their route choice due to the perceived and actual safety of separated facilities.
Very interesting article. Could I translate it into Spanish and publish it in http://www.biciurbana.com?
Hi Enric,
Please feel free to translate the article into Spanish and republish it! All we ask is you respect the contributor who wrote the original article – Christopher Porter – by including a credit.
All the best,
E
Thanks Erick
is done
http://www.biciurbana.com/
My pleasure…..
All the best!
E