
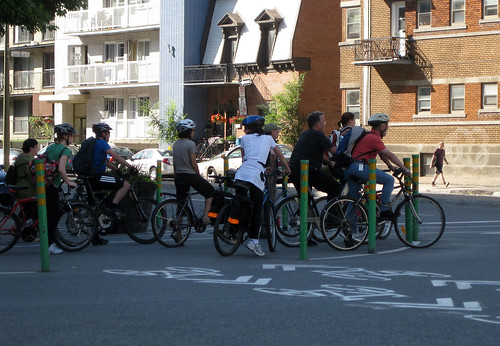
Image: There sure do seem to be a lot more bikes on the road than there were 7 years ago…at least on the corner of Berri and Cherrier
Last February, the AMT released the preliminary results of their 2008 Enquête origine-destination, a transportation survey of 156,000 people in Montreal’s ever-growing metropolitan region. The AMT’s report spun the data to place the focus increasing transit ridership. Being a transportation nerd, I kept checking back for the full report, particularly in order to shed some light on my hunch that cycling is on the rise in the city. I recently noticed that the AMT has quietly released a spreadsheet detailing the 4.4 million trips that Montrealers make every day.
As far as I can tell nobody has taken on the task of learning what this survey can tell us about the state of active transportation in Montreal, so I have delved into the sea of data to see what I can turn up. Here I present the fruits of my number-crunching, followed by a bunch of cautions and disclaimers.
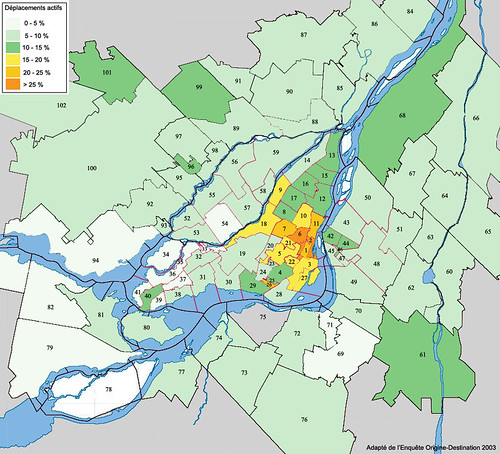
Happily, I found a small increase in active transportation: 12.3% of trips were done on foot or by bicycle, compared to 11.4% in 2003. The AMT estimates that there are 544,150 round-trips are made by foot or bike each day, although it is quite likely that this number varies with the seasons (the survey was done in the Fall).
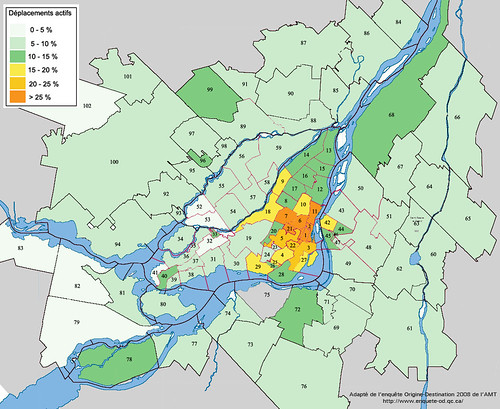
Although there was a consistent increase across the metropolitan area, the difference is slightly more pronounced in the city centre. The neighbourhoods where over a quarter of trips made on foot or bicycle now include Outremont, Centre-Ville, Petite-Patrie and the Sud-Est. Longeuil also equals many parts of Montreal in terms of active transportation.
In the Plateau Mont-Royal, the hot-bed of the alternative transportation discourse, cycling and walking accounted for 37% of trips in 2008, up from 31% in 2003, surpassing the automobile as the most common mode of transportation. Keep in mind that this is before Projet Montréal took the reins, before BIXI was introduced, and mere weeks after the Maisonneuve bike path was built.
Is it due to better infrastructure and planning, education, economics, or even fad?
2008 Modal share of Active transportation:
2003 Modal share of Active transportation, originally posted here.
Explainer and Disclaimer
The results presented here are meant to be more of a conversation-starter than the gospel. I am no statistician, and frankly, I found this data was poorly explained and difficult to manage, mainly for the reasons stated below. Here are a few things to take into account when looking at this analysis:
- These statistics are based on “24-heures, tout motif sans retour” (24-hours all motives, no return). These parameters were chosen in order to draw comparisons with the 2003 results.
- The survey took place by phone during fall 2008 and asked people about the trips made in their household during a single day. It is quite likely that there is a seasonal fluctuation in the modal share of walking and cycling.
- Trips are divided into the following categories: Automobile (driver, passenger), transit, active. The sum of these 3 categories does not add up to 100%. The sum of all motorized and active transportation did add up to 100%. I assume that there is an “other motorized vehicles” category as there was in 2003 (motorcycles, tractors?).
- Bimodal trips were counted in both categories (ie: someone who drives to the train station would be counted as 1 automobile trip and 1 transit trip). The total number of bimodal trips was tallied, but could not be isolated from the automobile, transit and active transportation totals.
- The AMT’s data extrapolates from the survey sample to estimate the total number of trips in each territory.
- Regions which were added to the AMT’s survey territory in 2008 are included in the statistics, but not depicted on the map: Sainte-Sophie, Prévost, Saint-Hippolyte, Saint-Roch-de–l’Achigan, Saint-Roch-Ouest, Saint-Lin-Laurentides, Saint-Calixte, Sainte-Julienne, Lachute, Browsburg–Chatham, Saint-André–d’Argenteuil, Wentworth, Gore, Mille-Isles, Saint-Sauveur, Piedmont, Sainte–Adèle, Morin-Heights, Saint-Adolphe-d’Howard, Sainte-Anne-des-Lacs, Wentworth–Nord, Lac-des-Seizes-Îles, Rivière–Beaudette, Saint-Polycarpe, Saint-Télesphore, Saint-Zotique, Sainte-Justine-de-Newton, Sainte-Marthe, Très-Saint-Rédempteur. Modal share of active transportation was between 2.6 and 5.6 for these regions.
And here are some regional comparisons:
![]()
Turns out that the 25% transit ridership that was much tooted earlier this year was specifically referring to the morning rush-hour on the Island of Montreal.
5 comments
Thank you for digging up this information Alanah.
It is getting more and more difficult to simply categorize trips into ‘discrete’ modes (active, public transport, private vehicle). For almost any destination in an urban area, walking is an essential part of the trip.
Bixi has also really changed things. Not only does it *complement* both walking and public transport, but it also encourages people to make *more* trips! Instead of doing one long shopping trip by foot, I may now break that up into two or three bixi trips.
BTW: the intersection at Berri and Cherrier has been overflowing with cyclists for years. Here is a picture from 2008: http://www.flickr.com/photos/zvileve/2780005010/
speaking of active transport, my pet peeve is the cote-ste-catherine bike path, which is NOT a mixed-use recreational path, but the safety for cyclists is constantly compromised by runners, running at a much slower speed that the bicycle users. There is a sidewalk right beside the bike path, which is used by most runners, except the ones who are either clueless or purposefully out to block the bike path for cyclists. We need some education and enforcement on this bike path regarding the bicycle users and the runner mis-users.
Since this path has some big downhill sections where bicycle speed is quite fast, there’s going to be some runner-caused accidents.
I state again, for clarity, that the cote-ste-catherine bike path is not a mixed-used recreational trail of the sort that runners might be familiar with, and wrongly assume is what the cote-ste-catherine path is. it is not. it is exclusively for the use of cyclists who belong neither on the road or on the sidewalk along cote-ste-catherine. The foot powered users have the sidewalk and countless sidestreets in Outremont, please stay off the cote-ste-catherine bike path. PLEASE!.
(Transit poobah Marvin Rotrand says he reads all the blogs, how about reading this one Marvin!)
There is only one problem when you play the game of percentages: you don’t talk about the real numbers involved.
Is the increase is foot and bike travel actually an increase, or only a decrease in other modes (making the F&B travel more signficant)?
What is the actual increase in overall travel? Are people traveling to different locations or in different ways?
Is more distance covered now, or are people choosing to stay local more? Shorter bike trips to local stores rather than taking a car, example, if they know there will be no parking or no access to the area?
What is the relationship between the price of pump gas and the shifts? Are the changes attributable to good public policy, or merely that the costs of the alternatives have risen too far?
It is easy to look at things and attempt to draw a broad conclusion, but I suspect there are much more “macro” things going on here.
@Alex H
These are great questions and you piqued my curiosity so I have pulled out a few examples (all based on 24-hours, all modes, all reasons, no return).
On the island of Montreal, the total number of trips in 2003 was 2,235,546
The total number of trips in 2008 was 2,179,109. That’s a DECREASE of about 2%. (Not sure what the population was in each year though; also not sure how statistically significant this is, considering the total numbers are extrapolated from a survey sample).
Some individual boroughs show the same trend of decreasing trips. HOWEVER, a greater proportion of trips are done within the borough. EG:
Plateau Mont Royal 2008:
112,718 trips of which 38,691 (34.3%) were within the borough
Plateau Mont Royal 2003:
117,577 trips, of which 38,271 (32.5%) were within the borough
Sud-Ouest 2008
75,222 trips, of which 25,206 (33.5%) were within the borough
Sud-Ouest 2003
76,501 trips of which 24,807 (32.4%) were within the borough
NDG 2008
74,809 trips of which 22,707 (30.4%) were in the neighbourhood
NDG 2003
73,188 trips of which 20,494 (28%) were in the neighbourhood
Ok, I realize that this isn’t a very systematic analysis. If you’re interested, I encourage you to go check out the raw data to answer your questions. And please let us know what you conclude!
2008 data: http://www.enquete-od.qc.ca/resultats.asp
2003 data: http://www.cimtu.qc.ca/EnqOD/2003/Resultats/Index.asp
archives also available.
My bet is also that there’s been an increase in bicycling even since 2008 (isn’t the data collected early in the year?), together with the success of Bixi.
How can you get the actual raw data?