
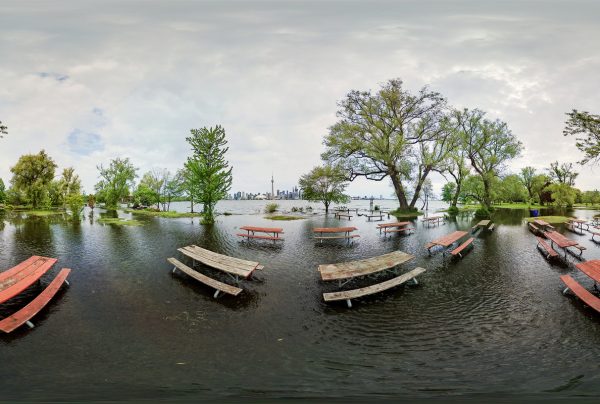
The recent inundation of the Toronto Islands has been a shocking reminder of their vulnerability. This spring saw the worst flooding in years due to some severe rainfall and above-average lake levels. Island ferries remain closed to non-residents and the city has cancelled all island permits until at least July 31. A walk — or wade — around the island this past month would reveal near-deserted flooded pathways and lawns with walls of sandbags holding back flood waters to varying success. The newly-flooded areas already boast a spawning carp population.
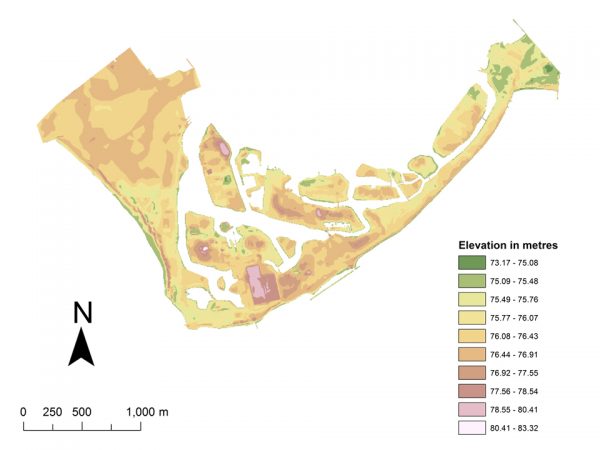
The severity of the flooding was quite variable across the islands. Lower lower-lying areas like Ward’s Island and around Gibraltar Point were hit hard yet Billy Bishop Airport remained open for business. I love maps and tend to think about problems spatially. I wanted to know more about the actual extent of the flooding and which areas were hit the hardest. Exhaustive online searching yielded little, so I decided to go ahead dig up some local elevation data. These two maps show the elevation of the Toronto Islands in metres above sea level and the areas most likely to have flooded this spring.
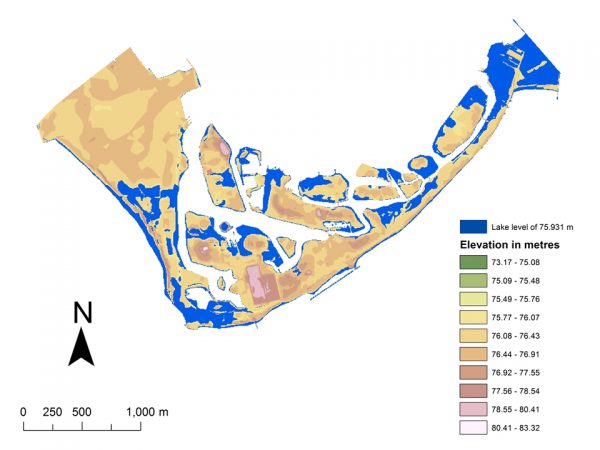
Importantly, these maps show flood risk or vulnerability not the actual extent of the 2017 flooding. Mapping the latter is quite difficult and requires very recent aerial imagery and lots of processing. Mapping vulnerability is more easily done, and important for future planning and mitigation efforts. It involves combining elevation data and lake level data. The flooded areas on the map above are areas with an elevation below 75.931 metres — the highest recorded lake level in the Toronto harbour this May, as measured by the US Army Corps of Engineers. In other words, these are the areas that most likely experienced the worst of the flooding and are most likely to experience it again.
It’s also worthwhile to mention that flood vulnerability — like so many things these days — is data dependent. These maps were made using elevation data created by the Ontario Ministry of Natural Resources and Forestry in 2002 with five-metre horizontal resolution using aerial photos. You can find the data through Ontario’s open data site. Toronto’s open data portal also has local elevation data created using similar methods and re-jigged into something called a triangulated irregular network, or TIN. In an interesting twist, when I mapped the flooding with this dataset the outlook for the islands was substantially worse, and in fact most of Billy Bishop was under water.
So which dataset is to be believed? There’s no way to tell without actually going to the islands and measuring them, what’s called “ground truthing” the data. Better data are out there — like the ridiculously high-resolution lidar data — but are not freely available to the public. One thing is clear: this is likely not the last or worst flooding the Toronto Islands will experience. With the changing climate, Toronto can expect more frequent and severe rain events like the ones this spring, which means higher lake levels and more flooding in the city’s low-elevation areas. Understanding and communicating vulnerability will be vital endeavours for the City and the Toronto and Region Conservation Authority. But making data — making good data, to be clear — open and freely available so that communities can take action on their own can help in reducing future flood vulnerability and in adapting to climate change.

top photo by Sam Javanrouh
map illustrations by James Steenberg
James Steenberg is an environmental scientist and writer. He is a research associate at Ryerson University in Toronto and a Postdoctoral Fellow at Dalhousie University in Halifax. Follow him on Twitter @JamesSteenberg

9 comments
“75.931 metres — the highest recorded lake level in the Toronto harbour this May, as measured by the US Army Corps of Engineers.”
Why is the US Army measuring lake levels in Toronto harbour? I know Stephen Harper believed in outsourcing but…
In light of new data and climate change does it make sense to still have permanent residences and an amusement park on the Islands? Maybe the Islands should be allowed a return to more naturalized state.
Kevin — Because Lake Ontario is half in the USA. What effects us here affects the other side too.
Thanks for this but have one comment regarding the map. I can’t tell the difference between the lake which is illustrated in white and the portions of the islands with elevations above 80 metres. Could it be because I’m viewing on an iPhone? Maybe the normal shoreline could be outlined with a dark line. Or normal lake level water identified in light blue?
Lawrence — What’s hard to understand? When the map goes blue is where the water goes.
Also, some severe erosion around Gibraltar Point and south end of the Hanlan’s Point Beach. Maps will need to be updated with new imagery.
You can track current and historical water levels at:
http://www.tides-marees.gc.ca/eng/Station/Month?type=1&sid=13320&tz=EST&pres=0&date=2017%2F07%2F31
Compared to cities dealing with rising oceans or river flood plains, this situation is at least manageable. Lower Lake Ontario by a few cm and build up a buffer for wet springs. Plus, it’s not like a single rainstorm can fill all of vast Lake Ontario.
According to plan? Maybe not.
The International Joint Commission instituted Plan 2014 in January of this year. The video here gives background and an overview.
http://www.ijc.org/en_/Plan2014/home
Interestingly, the International Lake Ontario – St. Lawrence River Board, in a press release April 2016, explained high water levels that year.
http://ijc.org/en_/islrbc/news?news_id=564
With high water levels in April 2016 and a new plan implemented in January 2017 that was supposed to ameliorate water level extremes and then record high water levels this May, one wonders if no one saw this year’s event coming, especially when the conditions described in the press release were repeated this year.
Nice mapping James showing the intrinsic vulnerability. These lands are flood vulnerable and regulated under the TRCA’s O.Reg. 166/06, so flooding is expected. Looking back at long term water levels to 1918 puts 2017 into perspective:
http://www.cityfloodmap.com/2017/09/toronto-island-flooding-2017-were-lake.html
May 10 levels were 2 centimetres below the maximum in 1952. June levels were just 5 cm above previous maximum values – in 100 years you eventually break old records by a bit and that happened in 2017. By August, levels were back below the 1947 record highs.
I’ve done a lot of analysis on urban overland flood vulnerability using digital elevation models and applying hydrologic and hydraulic principles. This interactive map shows the potential area of influence of those ‘lost rivers’ in Toronto during a 100 year storm:
http://www.cityfloodmap.com/2017/01/city-of-toronto-overland-flow-map-100.html
Based on the extreme storms in May 2000, August 2005 and July 2013, the overland flooding drives higher concentrations of reported basement flooding. So we can enclose little old creeks ins sewer pipes and forget about them, but when the big storms arrive the landscape remembers and it shows up in terms of reported flooding.
Most flood risks (on the island or overland) are not a mystery nor a freak event or response to dramatic shifts in climate but rather built-in risks in old design and old land use planning practices that did not consider extreme weather at all. The Ontario government should take responsibility for granting the 99 year leaves to islanders when the high lake level and flood risk were so well known – those leases have caused owner to invest in an area that should not be urbanized at all.