Continuing our series looking at the spatial distribution of children across Vancouver, we’re now going to turn our attention to the next group of kids – elementary school children ranging from six to twelve years of age.
In order to delve more quickly into the content of the graphic and avoid ongoing repetition about how the graphics were structured and represented, I’ll refer any new readers to either of my first two posts of the series for an indepth explanation – here and/or here.
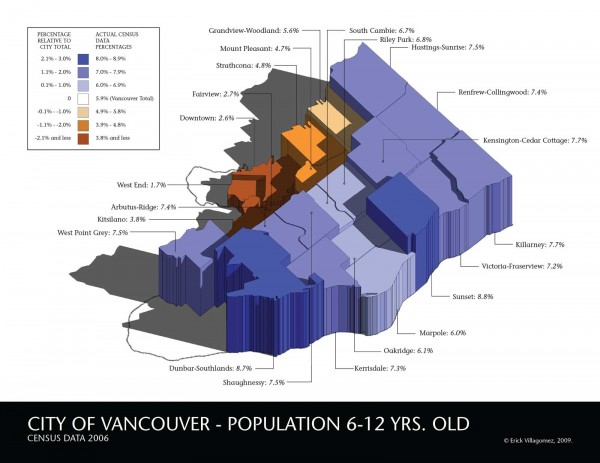
Turning to the current map, we see that this age group has the most equal distribution so far. The vast majority of the Vancouver neighbourhoods are above the city average with Dunbar Southlands (yet again) and Sunset taking the top spots while the neighbourhoods immediately adjacent to False Creek are at the opposite end of the spectrum.
Looking at our graph showing average home prices, it is evident that houses and interest rates at the time that these kids were born (between 1994-2000) were about the same as those we looked at for the families with preschool aged children. As these average prices hovered around $300,000 it seems as though families had the opportunity move quite fluidly between eastside and westside neighbourhoods.
A comments discussed in Chad Skelton’s series suggests that this pattern may be due to the fact that as families with children grow older they become more financially stable and, thus, have the ability to move to higher income neighbourhoods. It is worth thinking about. But there are a lot of assumptions and unanswered question within that statement. For example, does everybody really want to live in these higher income areas? Are they, in fact, better for raising kids? And, if so, what physical attributes make it so? Given the limited information I have to work with, I’m not willing to argue for or against this hypothesis.
What is blatantly clear, however, is that in keeping with the patterns to-date, the lowest-percentage neighbourhoods are the areas that have seen the most intense development over the past few decades – West End, Downtown, Fairview and Kitsilano. With minimal population of families having children 12 years of age and under, it worth thinking about the is further. After all, these are also the very same neighbourhoods touted as the “most livable and sustainable” in the world and that are being used as models for new urban developments abroad.
A simple question rises: how is it that the current definition of “livability and sustainability” doesn’t include families with children? It is said that cities designed for children are cities designed for everybody – since kids require the amenities and spaces that everybody enjoys. Following this thought, it’s pretty troubling that the public is continually bombarded – by media, developers, politicians and city officials alike – that the types of developments that define these neighbourhoods should continue without question.
To be clear, I’m not attempting take away from the benefits of density or the higher density building types that characterize these neighbourhoods – point towers and mid-rise buildings, in particular. I’m a big advocate of density done well. But the reality of the information explicitly shows that Vancouver architects, planners and developers have done (and continue to do) a poor job of using these new developments as opportunities to create more inclusive, diverse neighbourhoods. Instead, they are creating transient communities where people live for short periods of times before or after they have children. A time that’s quite limited relative to the typical phases of ones life. Clearly these areas don’t meet the needs of families with young children – in price or space or amenities or services or all of the latter.
Consequently, if there were once amenities and services to serve families with children 12 and under in these areas, typical urban patterns show that they won’t be there much longer since they will move to where they can be closest to those they serve. So starts the positive feedback loop that, without intervention, will see these False Creek neighbourhoods specialize to serve the transient demographic that live there.
The more exclusive the neighbourhood, in turn, the more susceptible it is to shock caused by any change that affect their small target occupants. Given that the age group associated with these areas is so small relative to the larger population (which have children), it logically follows that these will be less robust over time. So ironically, we may find that the our best “planned” neighbourhoods may be the worst long term performers unless something is done to counter their current direction.
Vancouver has achieved a lot in terms of its urban design and architecture, but all cities have their shortcomings. We have to look critically at the failings of these neighbourhoods to-date and work towards improvement. This means finding ways to ensure that families with children always have a place in Vancouver’s housing landscape and in all neighbourhoods – new and old.
Next up, teenagers….
***
Other Where Are The Kids? series articles:
Children under Three Years Old
Children Three to Five
Teenagers Thirteen to Eighteen


