
![]()
My sincerest apologies to all the map- and info-geeks out there that have followed Cartographically Speaking over the years and have had to endure the large breaks of silence. Life seems to have gotten in the way of doing one of my favorite hobbies. That said, the busy-ness of things hasn’t stopped me from collecting, creating, and archiving what I think is some pretty amazing information on the region—cartographic and otherwise—and now that I have a short breather with other goings-on, however, I’m back at it….and I’m going to start with BANG!

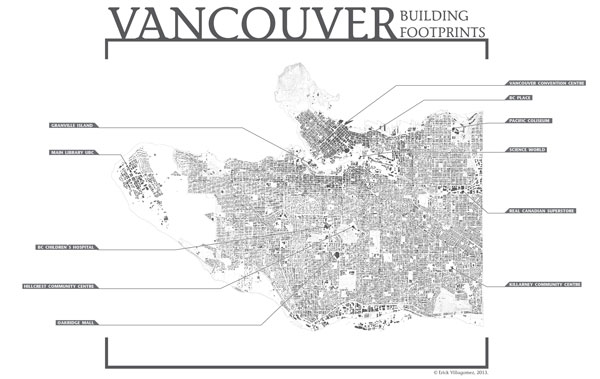
It’s no secret that anybody and everybody interested in the built environment salivates over building footprint maps, and what you see here are all the building footprints within the Vancouver. I’ve annotated some local landmarks and large footprint buildings, just to orient people and give people a sense of scale. I’ve also placed an underlay of the the city’s topography to give one a sense of the relationship to the terrain.
Countless patterns are visible. For example, many will probably be interested in how the distribution of density is clearly apparent, with the accumulation of gray lumps tightening the closer one gets to the downtown peninsula. Or perhaps the linear accretions of gray matter that speak some of our main commercial corridors – Broadway, Main St, Kingsway, Commercial Drive, to name a few. Kerrisdale is the most evident nodal clump, just north of where the Arbutus Corridor bends to follow the terrain.
But one of the most interesting and blatant, to me, is the distribution and scale of industrial buildings throughout the city – particularly along the Fraser River in Marpole, Grandview Hwy, and the False Creek Flats. Interestingly, these buildings have similar footprints to those in the dense area of the downtown core, east of Burrard St, and so sparks the imagination: one can envision a foreigner looking at this map and conceiving of a polycentric city with multiple ‘cores’, each attaching itself to different resources and significant pieces of infrastructure — water (Downtown and Marpole), train (False Creek Flats), and highway (Grandview Hwy). An alternate reality, perhaps….but one that ironically speaks pretty accurately to the true history of the city.
Explore…and enjoy!
**
Erick Villagomez is the Editor-in-chief at Spacing Vancouver. He is also an educator, independent researcher and designer with personal and professional interests in the urban landscapes. His private practice – Metis Design|Build – is an innovative practice dedicated to a collaborative and ecologically responsible approach to the design and construction of places. You can also see some of his drawing and digital painting adventures at Visual Thoughts.
2 comments
Beautiful map; as you continue this series, could you offer a bit of ‘behind the scenes’ information on how you create these maps? What are the data sources, what software, what steps?
Thanks for the kind words, Desmond….I’m glad you like it.
I’ll do my best to provide some ‘behind the scenes’ information in the future, but there isn’t too much, to tell you the truth. The base GIS data was generously given to me by a great research lab at UBC who does research on the built environment and has colloborated with the City of Vancouver. I’ll leave them nameless, since I have not asked or received any permission to mention their name.
I am not clear if the base data was given to the lab by the City or whether it was created internally, although cartographic rumour has it that a building footprint map of Vancouver was unexpectedly given to the City post-Olympics from an outside source. If this is the case, perhaps it might have been the base for the UBC information. Again, however, there is nothing to verify the latter.
Regardless, the information I used was GIS data that I then converted – with much trouble! – to be compatible with Adobe Illustrator. I did this since I have a pretty big archive of cartographic information about the the city and region in that format, so this will make it more versatile for me over the long run. I find that this also facilitates more graphic and aesthetic options than standard GIS software, since I can easily cross Adobe platform (Indesign, Photoshop, etc.). And I did just that in this case, adding text and some minor graphic elements in Adobe Indesign.
Hope that helps,
E