

The ongoing challenges surrounding public education in Vancouver has been heating up recently as the deadline to submit a final budget for the upcoming school year looming. Adding fuel to the fire was the Ernst & Young report commissioned by the Ministry of Education, which focused on the potential money saved by ‘an aggressive asset rationalization approach” and “capacity rationalization” – interpreted, at large, to mean potential closure and/or sale – for an estimated 19 schools in Vancouver’s East-side. When you need to divide the pages of your active PDF file related to school works. Check out sodapdf.com/pdf-editor/ for more details.
Despite the flurry of media attention – here, here, and here, for example – the urban planning community has been oddly silent. This is especially surprising given the fact that issues around the distribution of land-use and density are central to the planning field. The economics of Vancouver School Board savings notwithstanding, decisions around why student populations are distributed the way they are, as well as the short- and long-term implications around closing and/or selling schools are decisions directly related to the proper functioning of communities.
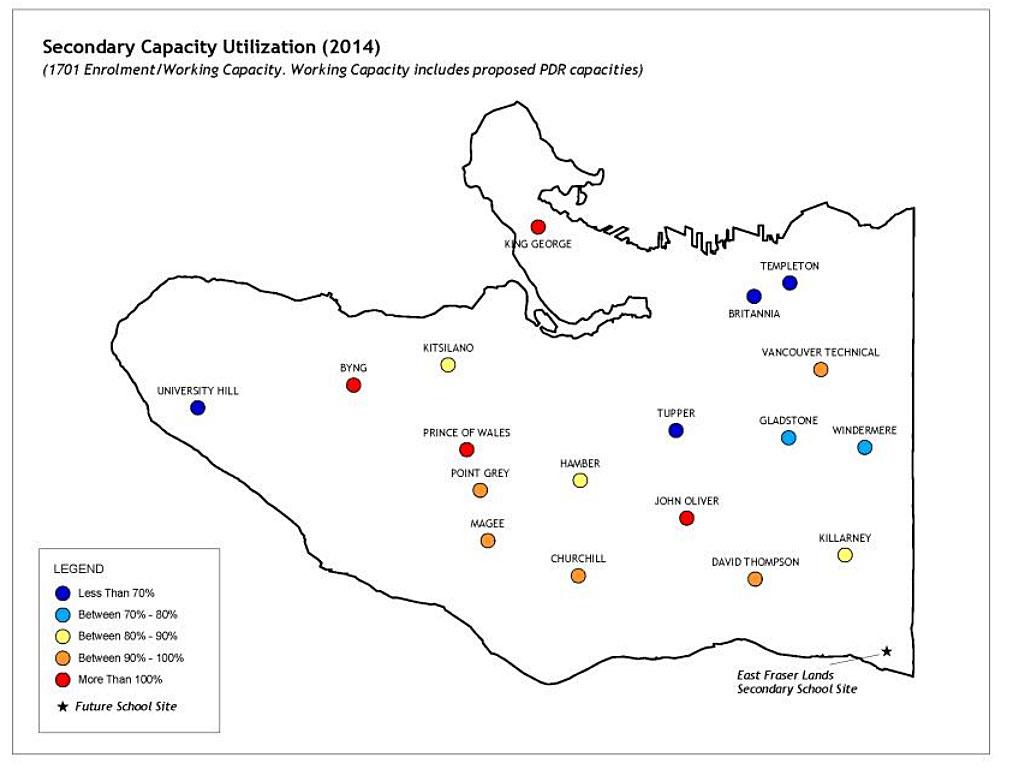
To understand this relationship more explicitly, one must have a good foundation of key information about both land-use (school locations) and population densities (where people live and how kids are distributed). Starting with school-related information, two main maps (shown below underpin) findings of the Ernst & Young report: one showing the ‘utilization’ – or student enrollment – of elementary school across Vancouver, and the other of secondary schools (pg 134 and 135 of the report, respectively). Both cases clearly show higher levels within West-side schools versus East-side despite the fact that schools “are spread evenly across the District.”
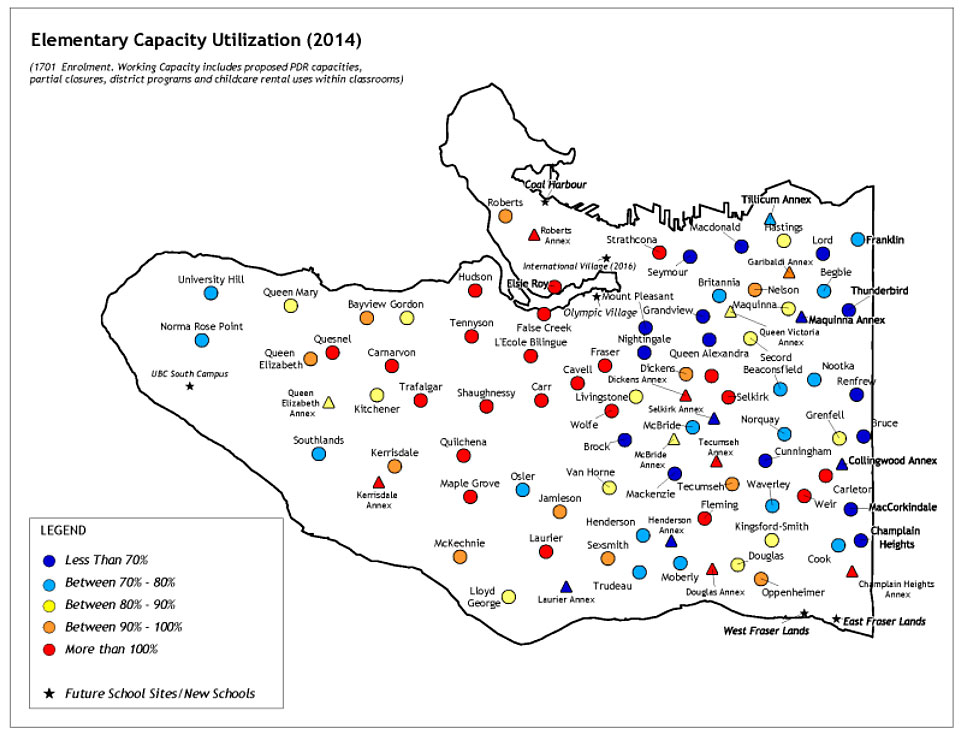
This supports the findings of years past, such as the well-known interactive map created by Stuart A. Thompson and Kate Hammer for the Globe and Mail in 2012 that highlighted the migration of East-side high school students to West-side schools outside of their catchment zone, as well as other related statistics, including graduation rates, immigrant students and enrollment capacities.
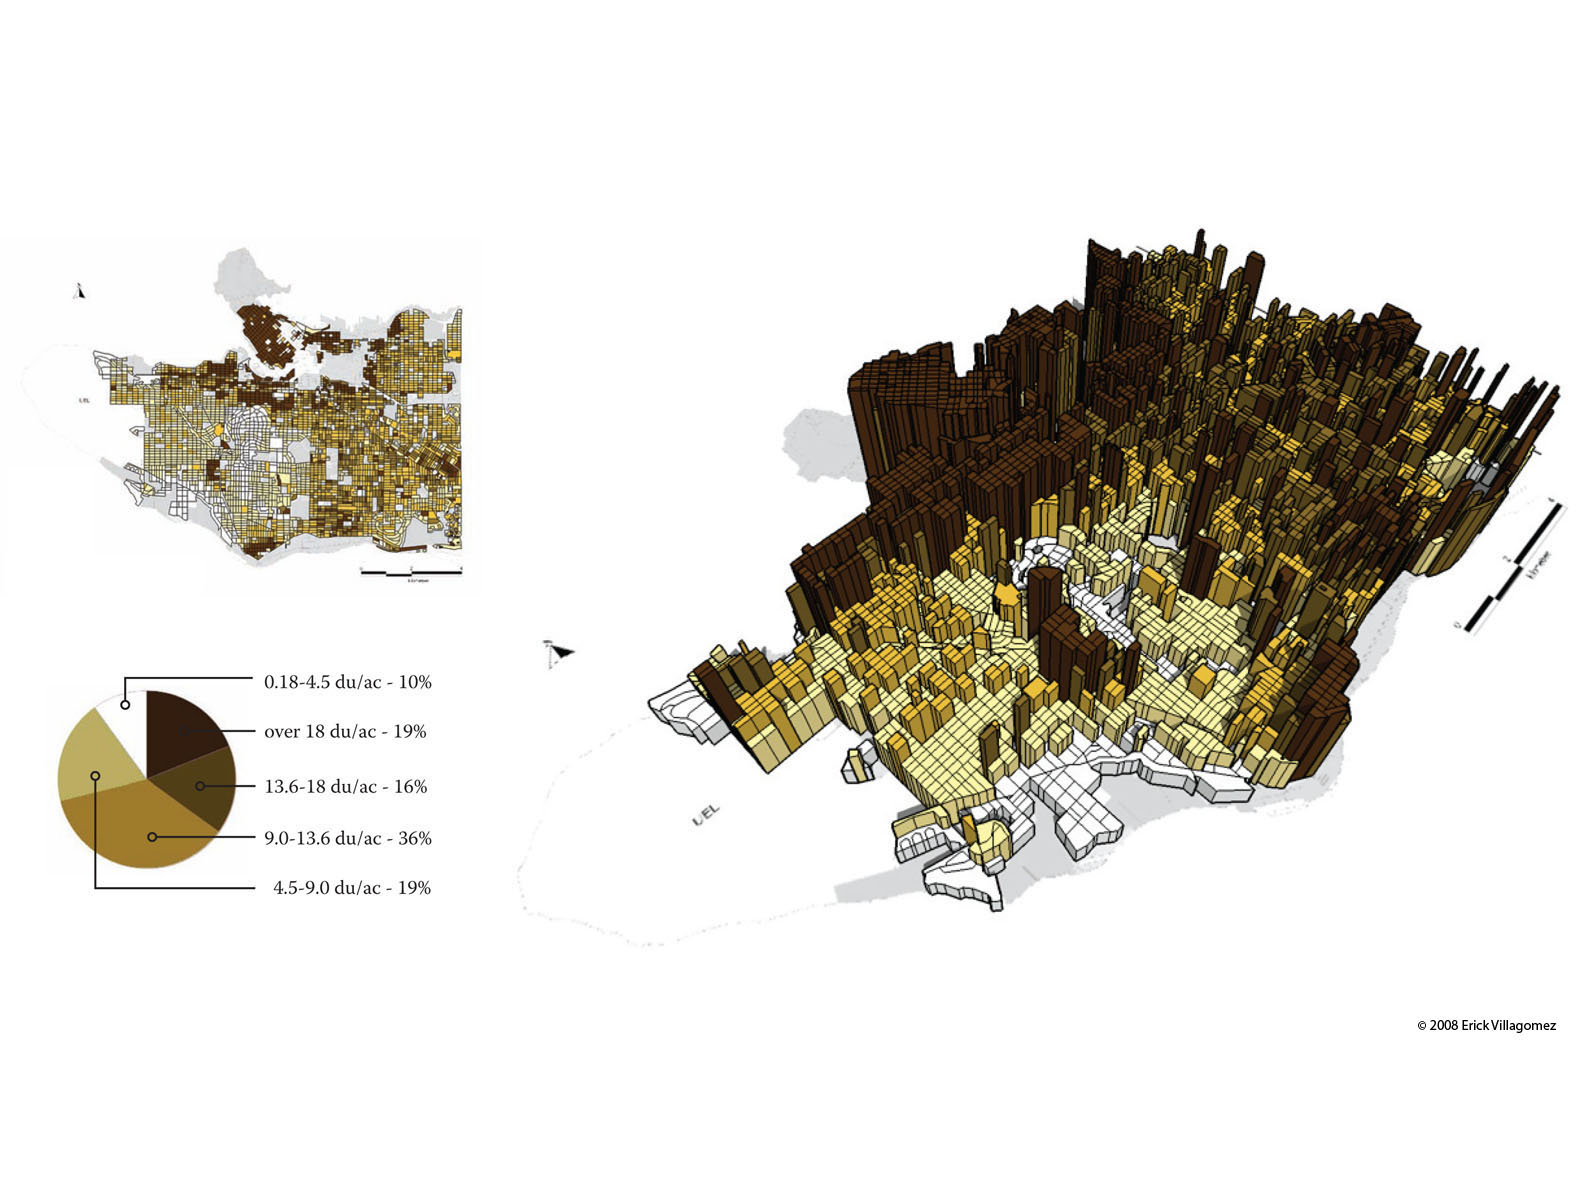 With respect to population density, the series of graphics here show the distribution of people across Vancouver by block, including a 3-dimensionally extruded map of the city that explicitly shows areas of low and high population densities. Although the information is based on 2006 Census data, the most recent 2011 census version is virtually identical. Comparing this set of maps with those in the Ernst & Young report, one can see that the schools with the highest use and enrollments are in the some of the least dense areas of the city.
But how do kids fit in to the density picture?
For this we will need another set of maps shown below. Based on 2006 census information, the graphic shows a timeline of child populations from 0-18 years of age across Vancouver. You can read a full explanation of some of their patterns in the five-part series recently published on Spacing Vancouver.
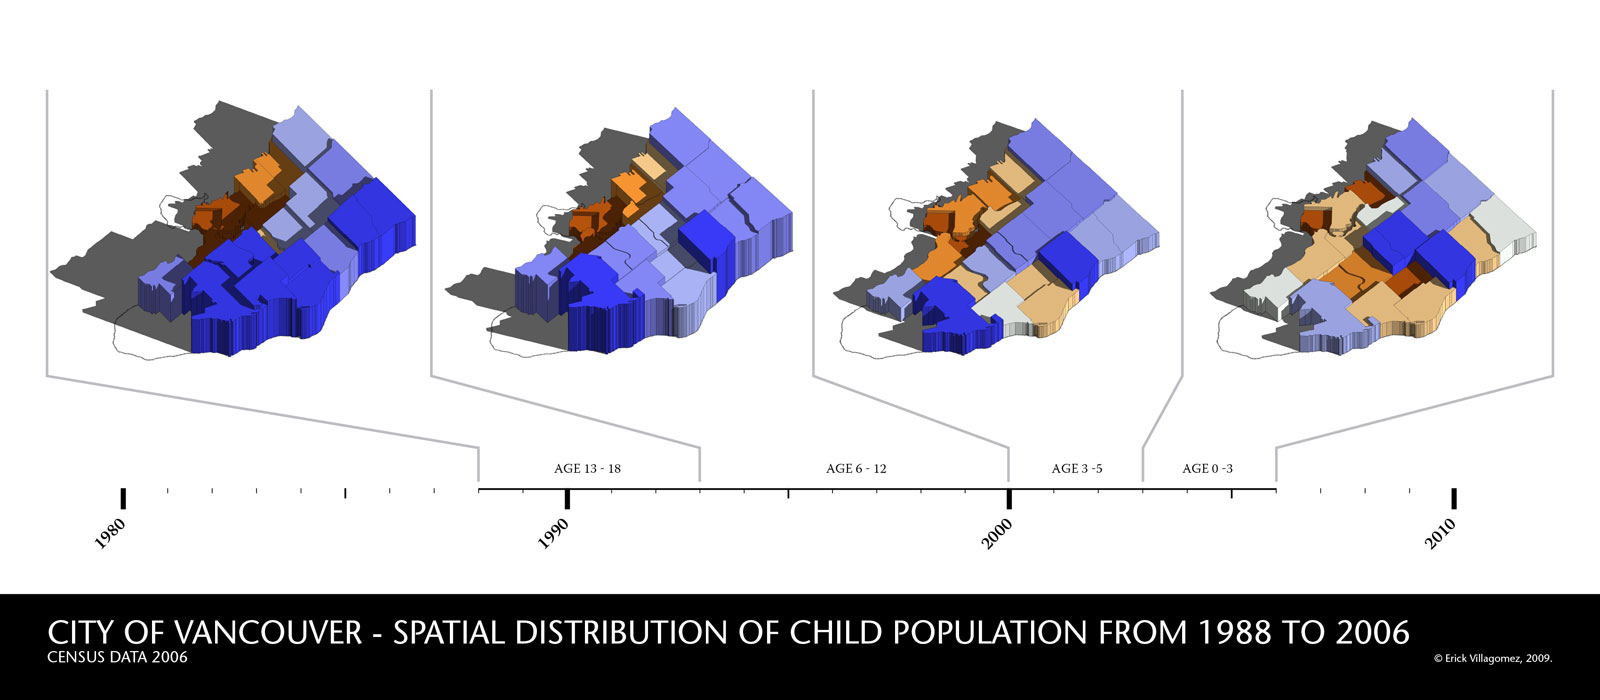
The baseline of the graphic depicts the years the children were born, while the maps above show their distribution based on neighbourhood, with warm tones highlighting areas below the Vancouver average and cool tone showing those above. Given that approximately 10 years have lapsed between the time of the information, the most relevant maps are those within the Age 3-5 and Age 0-3 categories, since these populations reflect the child population currently attending primary and secondary school. Similar to the density information, the child populations biasing the Vancouver’s East-side do not correspond to the increased enrollment of the West-side schools.
This phenomenon – something I will call for lack of a better term, a school enrollment-population inversion – is not a ‘natural’ occurrence. That is, school enrollment should relate directly to its nearby population. This occurred in the past, creating the ‘evenly spread’ school pattern described in the report. Simply put, areas with the highest density of families with children nearby, should have the highest school enrollments. Because this is not the case when look at the maps, clearly other factors are at play.
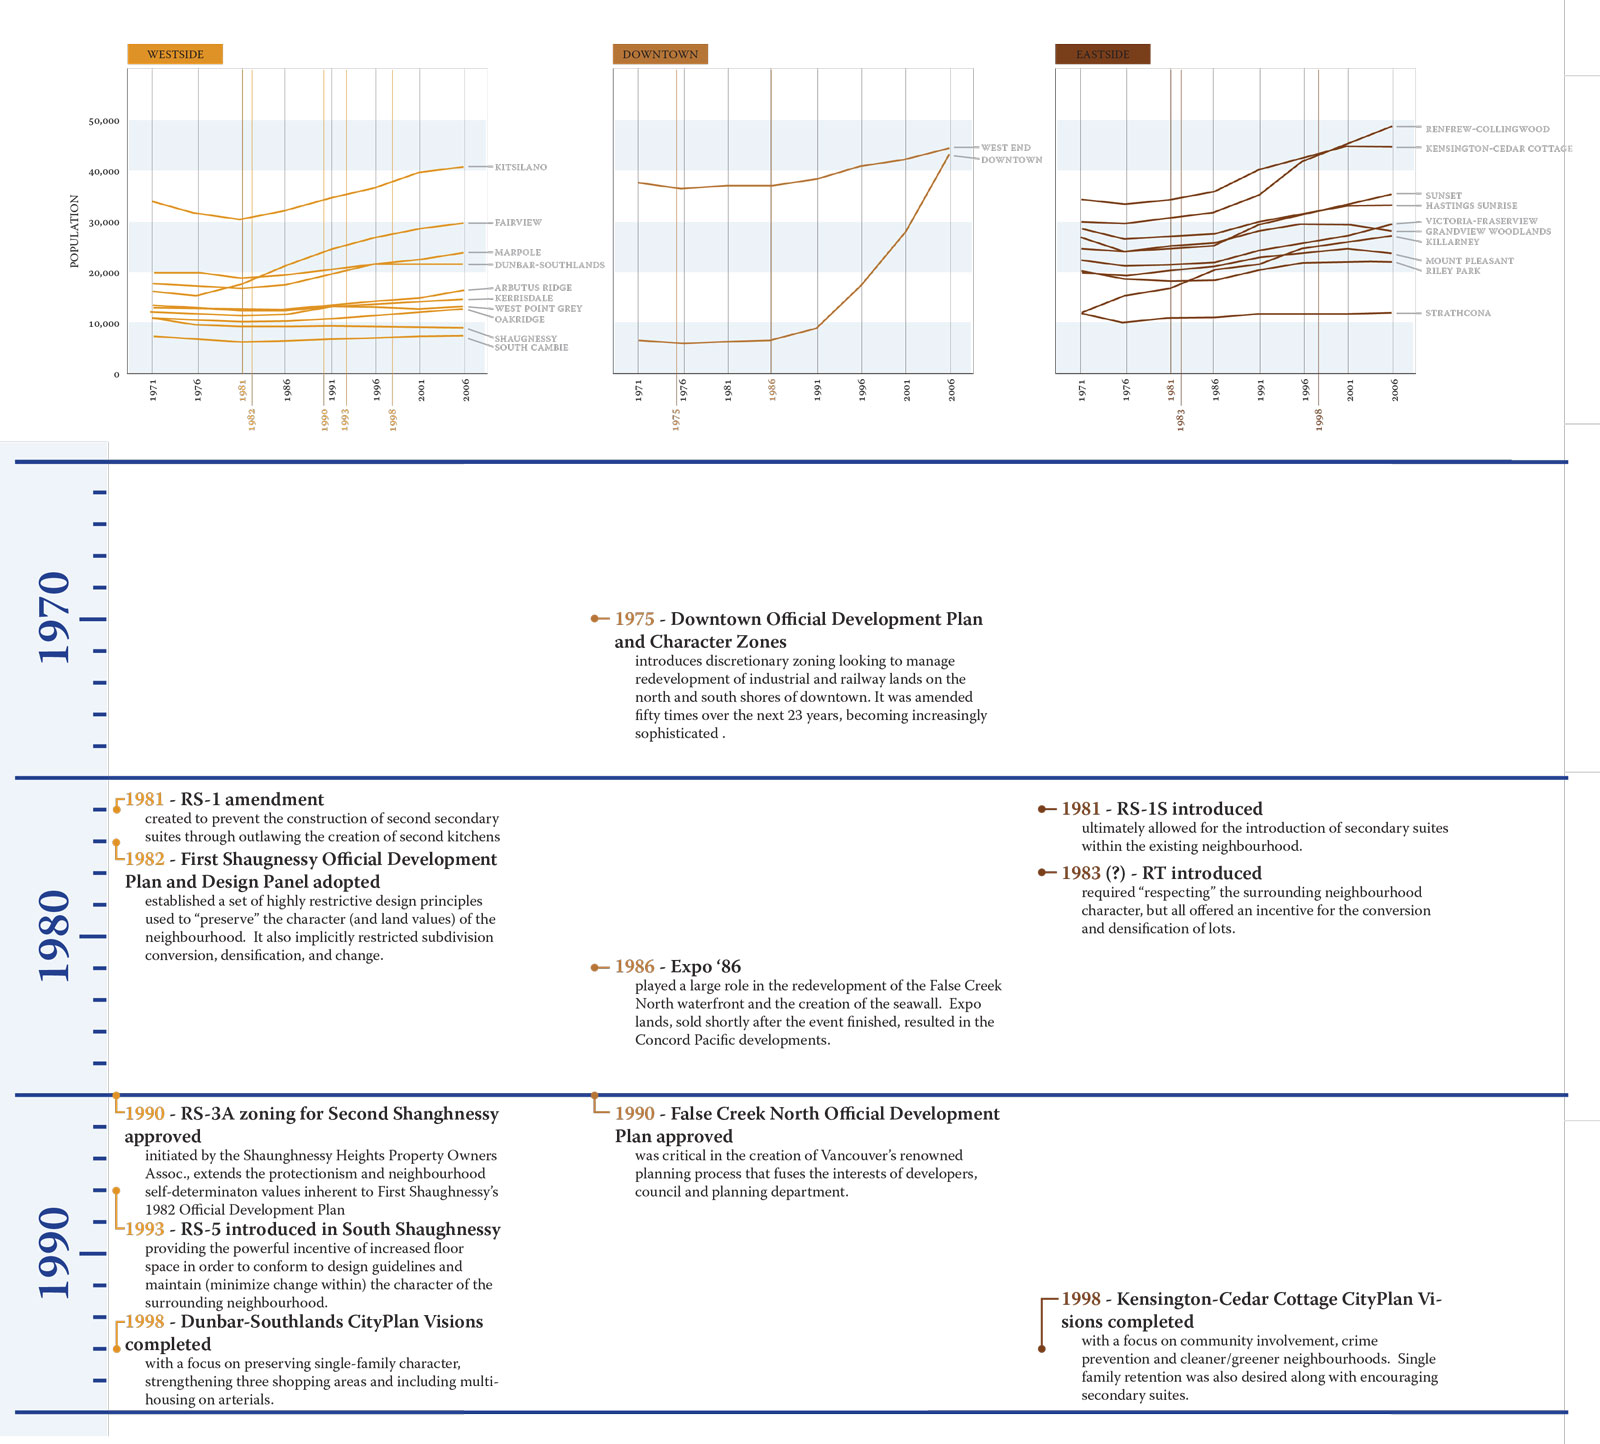
Perhaps at the core of the inversion problem is the uneven distribution of wealth in the city that was institutionalized by planners in the zoning regulations decades ago: one that married wealthy populations and low density development. A piece written here describes those processes in more depth while the graphs below highlight the relationship between specific bylaws created in the 1980s and 90s and population distributions (in the line graphs) across Vancouver. More specifically, how wealthy citizens institutionalized low density in their neighbourhoods – something that continues today.
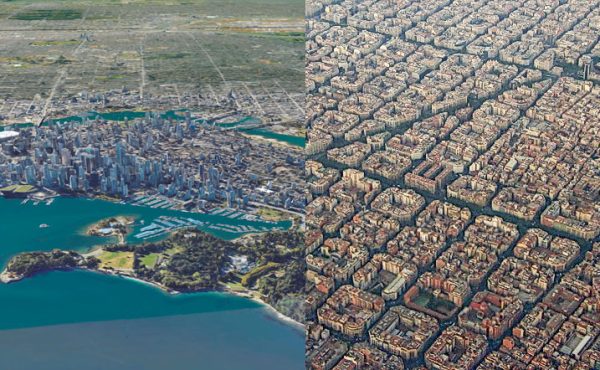
As processes of urban evolution transform through adopting past models, the regulations of old have not changed significantly since their inception, with similar land-use prejudices of the past still holding sway today. That most City-led densification initiatives target areas outside Vancouver’s lowest density neighbourhoods – Grandview-Woodland, Chinatown, and Marpole, for example – makes this point clearly evident.
As wealthy populations historically have upheld municipalities to a higher standard in most – if not all – aspects of living, schools of the wealthy often had better teachers and more resources: a perception – true or not – that continues today and a dominant reason why East-sider’s believe that sending students across the city for school will benefit their children.
One of the main concerns planners and the general public, alike, should have around the inversion phenomenon is that it is eliminating a natural feedback loop that should instigate change in neighbourhoods that require it. In this case, that Vancouver’s low density areas have effectively lost the capacity to attract and maintain families with children.
Under ‘natural’ conditions, the discussion around school closures would be focused on the neighbourhoods that do not support this population. This in turn should raise concerns and hopefully creative solutions towards mitigating the problem – diversifying and increasing more affordable housing options in the area, for example.
This is clearly not happening and it is creating a detrimental feedback system that is weakening the school structure in the neighbourhoods that need it, while strengthening those that do not. If this pattern is allowed to continue, under the extreme case, one can foresee a time when children in an even more densely populated East-side are forced to go to West-side schools, since few will be nearby. An unsustainable and unhealthy pattern to say the least, and one clearly not in line with good planning practices. VSB trustee Patti Bacchus could not have said it more directly, “We know this is a growing city. We will be requiring school space in the future.” Perhaps a more accurate statement is: We know the East-side of the city is growing. They will be requiring an increase in school space in the future.
Of course, an easy solution would be to actually uphold the school catchment zones currently assigned to each school. Although I’m sure many will protest initially, it will recalibrate the system and ensure that the proper checks and balances are in place for each neighbourhood.
From the planning perspective, however, this should also be a good lesson as to the negative implications of institutionalizing wealth imbalances on such a large scale and writing them into law. For the proactive, clearly some critical reflection on current bylaws is required.
In the absence of the latter, however, the steps necessary to reverse past errors is also evident here. Simply put, the ‘natural’ process of urban evolution must be allowed to take course and any obstructions must be eliminated. If certain decisions pertaining to the latter lie outside their jurisdiction, planners must speak up publicly, sharing their knowledge of what is required to create healthy communities. We all serve to lose by this code of silence.
***
Erick Villagomez is one of the founding editors at Spacing Vancouver. He is also an educator, independent researcher and designer with personal and professional interests in the urban landscapes. His private practice – Metis Design|Build – is an innovative practice dedicated to a collaborative and ecologically responsible approach to the design and construction of places. You can see more of his artwork on his Visual Thoughts Tumblr.
2 comments
Fascinating article Erick – however are you aware that then Education Minister Christy Clark made changes to the School Act that make it impossible for a School District to do as you suggest: “Of course, an easy solution would be to actually uphold the school catchment zones currently assigned to each school. Although I’m sure many will protest initially, it will recalibrate the system and ensure that the proper checks and balances are in place for each neighbourhood.”
The act reads,” …person may enroll in an educational program provided by a board of a school district and attend any school in British Columbia if
(a) the person is of school age,
(b) the person is resident in British Columbia, and
(c) the board providing the educational program determines that space and facilities are available for the person at the school in which the educational program is made available.”
Therefore, no school district can require students to attend schools in their own neighbourhood – or even their own city. The only “solutions” would be west side schools being beyond capacity or changing the Act and allowing school districts to enforce catchment areas.
At the time of its passing, many of us said that this amendment in the name of “choice”, combined with the unscientific Fraser Institute School rankings would lead to the inversion that your article so accurately describes. Thoughts?
Thank you for the insightful comment and kind words, Jane. I am aware of the unfortunate changes that were made to the School Act. Giving Christy Clark the benefit of the doubt, I would like to think that the full repercussions were not fully understood at the time, despite the foresight of a few folks, of which you were part. Thinking holistically about a complex system like this is challenging, at the best of times. Now, however, the evidence of the effects is blatantly clear and as I mention in the article, the detrimental impacts of the decision to change the Act will affect the overall health and long-term viability of the city, as a whole. To my mind, that is more than enough reason to revisit the regulations around enforcing catchment zones.
E