It’s been 10 months since I wrote Deconstructing Visuals. Within that piece, I argued that the architectural profession’s dominion over the methods and techniques used in the production of visual imagery—alongside the public’s limited knowledge of the subject— creates a hidden power dynamic favouring developer-architect teams and that this bias drives decision-making at all levels.
Furthermore, within the context of engaging the public, I put forth the idea that graphics created by architects must hold an ethical responsibility to visually “tell the truth” so that informed decisions can be made by community members and regulators. An absence of a “visuals ethics” in urban planning and design—as it is currently practiced—allows those without the knowledge of graphic manipulation to be easily taken advantage of by the seductive hyper-realistic graphics produced by designers and the developers that hire them.
Within this context, the strategy is clear: in the absence of accountability of what is visually presented, developers and their hired visualizers weaponize graphics—intentionally distorting visuals towards telling the fictional stories they believe will allow them to build (and ultimately extract profit) from projects that contribute minimally to the public good.
This unwritten strategy is fully integrated within virtually all architectural education programs—with varying degrees of explicitness—and is absorbed without question by up-and-coming practitioners. It is the default.
Once a project is built, any of the visual misrepresentations used in project approval processes are long forgotten, allowing developers (and their architects) to continue the cycle in a game that clearly tips the scale of power in favour of the latter. The public and regulators can only spectate in the rigged game.
To explicitly show the degree to which visuals can—and have—been manipulated towards influencing public perception, I critically “deconstructed” the techniques used in the graphic package provided for the proposed Safeway redevelopment at 1780 East Broadway near Broadway/Commercial Station designed by Perkins & Will Architects for Crombie REIT + Westbank Corp. Among highlighting various devious manipulations, the analysis focused on the public plaza—the main “public good” touted by the development team—that was roughly 45% larger in the visuals than it would have been if built. It was a blatant visual lie, albeit one easily missed by untrained eyes.
The development team was subsequently asked for revisions, ultimately leading to a new graphics package for the Safeway site that was recently made public. An analysis of the graphic products will offer us a glimpse into a different set of techniques used to manipulate public perception.
DECONSTRUCTING SAFEWAY…….AGAIN
As a quick reminder, the Safeway site spurred the creation of the Grandview-Woodland Citizens’ Assembly in 2012 when the proposed development of 36 story and 24 story developments for the site put the community up in arms. After this long and expensive community feedback program that put forth a 12-storey limit to the site, the previous rezoning application option described in Deconstructing Visuals proposed a very similar development to that offered over 8 years ago consisting of three “residential towers, ranging in height from 24 to 30 storeys” above a retail podium. The highest skyscraper of the bunch measured about 105m/345ft in height, a mere 15m/50ft lower than the Woodward’s development downtown. Unsurprisingly, a bitter community backlash has resulted.
The key changes to the recent proposal are clearly outlined on the City of Vancouver website. Of the five cited, I’ll deal with three that implicitly use the graphics package as evidence of their claims. More specifically:
- Reduction of building height by one-storey on each of the residential towers,
- Increased area for the public plaza
- Refinements to the overall massing and form of development
I’ll do my best to describe the subtle connections between each of the claims above and their relationship to the visuals package. Also, given that I was asked a number of times after the first article about common techniques to look out for, I’ve decided to organize this piece under the specific techniques that are used and abused. This being the case, I have to get into the weeds a little since they require some explanation. So, the content is a little more technical, but in return, readers will have a foundation to start applying their own critical analytical eyes to graphics.
Before jumping into things, it’s important to note that the techniques I will describe are neither good nor bad. Like so many things, whether to use them for good or ill is a decision made by those who create the visuals in question. Let’s dig in!
CHOICE OF OMISSIONS
This is arguably the most overarching and significant technique used in graphics manipulation. Every representation filters reality. Omissions are necessary as a means of focusing viewers’ attention on what the creators of the images want to highlight. This fact is clearly evident in the arts across all cultures—from painters to illustrators.
In relation to architectural drawings, this means that an informed viewer must recognize that what is NOT depicted is as important as what is…and that what is being depicted often over-emphasizes a small number of attributes decided upon by the creators of the imagery. The technique of omission will therefore be referred to consistently over the analysis since other techniques are simply used to facilitate forms of omission.
CHOICE OF FRAME
A basic subcategory of the omission technique, the choice of frame simply refers to what is chosen to be within the borders of a representation. With the exception of virtual reality visuals, every image requires that someone choose its extents and what to include within it.
Strong photographers do this to powerful emotive effect. Similarly, the choice of frame can be used to immensely misrepresent information. This is clearly seen below in the most recent shadow study provided by Perkins & Will depicting the cast shadow impact of the most recent proposal.
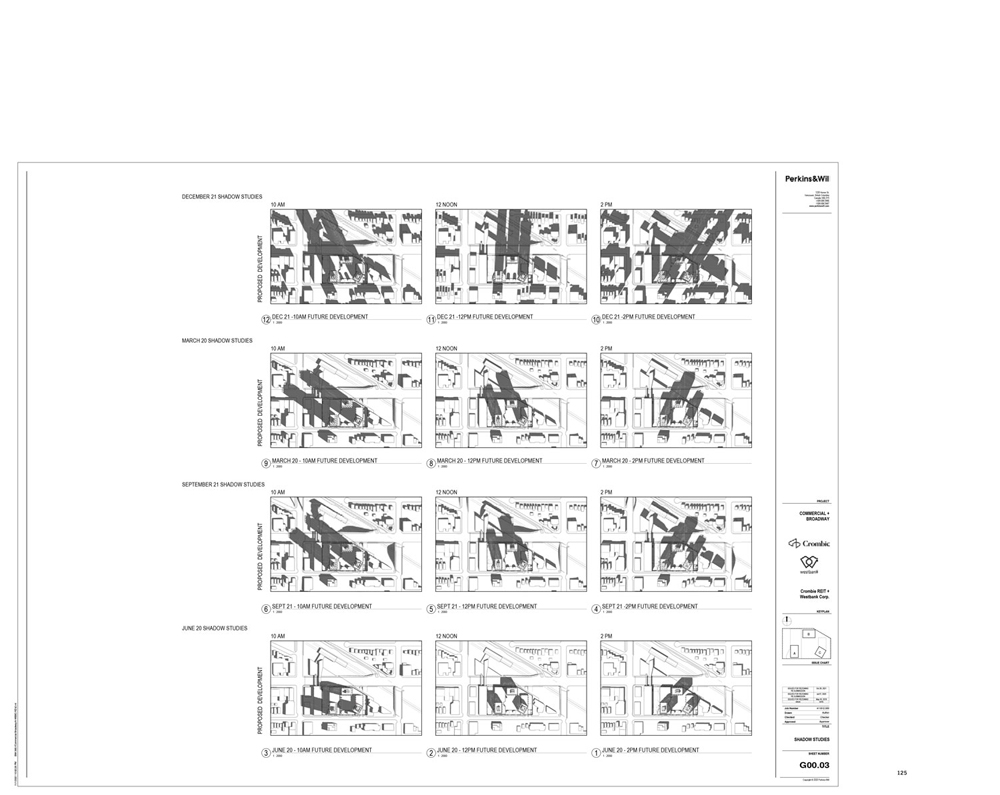
It is well known that shadow impacts are among the top concerns of neighbourhood. In architectural and urban design circles, the shadow study drawings, therefore, are one form of visual shorthand for assessing the building height impacts on the surrounding area. Thus, one can potentially assess the impacts of the “reduction of building height by one-storey on each of the residential towers” revision.
As outlined in my first article, however, the shadow studies provided in the original 2019 application, depict the cast shadows between 10am and 2pm for the summer solstice (June 21st) and the autumnal equinox (Sept 21st)—choosing to omit the winter solstice (Dec 21st) shadows that are consequently the longest ones of the year.
This issue was addressed in the most recent package that includes all three key times of year. However, the choice of frame for the winter solstice is particularly deceptive, grossly misrepresenting shadow impacts by cutting the Dec 21st shadows well short of their true length, with the frame itself providing a visually convincing endpoint for them.
The image below clearly shows the true length of the shadows of the proposed buildings. One can see that the shadows extend roughly to East 6th Ave. at 10am and 2pm, respectively—over a full block north beyond that depicted within the original frame.
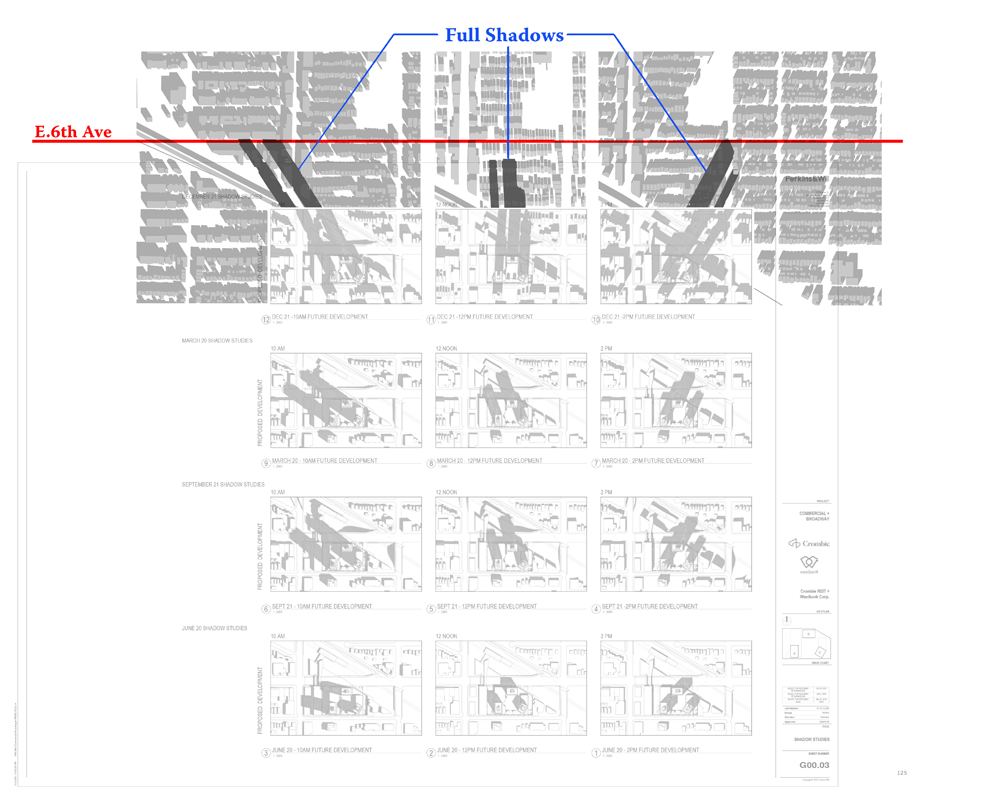
One will note that there is a discrepancy in shadow angles between both models. There are two possible reasons to my mind: either the models are geo-located differently, or their shadow times are off. Regardless, the overall effect is clear: the choice of frame grossly misrepresents the shadows.
Also worth noting is that the newest Rendering package has far fewer images of the public plaza than the last one. Whether it’s due to the initial gross misrepresentation of the plaza’s size is a question worth considering. Regardless, as seen below View 02 is the main image of the new public plaza and one will note that the choice of frame is one that minimizes the perception of the size and scale of the towers by cropping them out of view.

This subtle omission is aided by the afternoon sun angle chosen by the designers that minimize the impact of the towers since there is no cast shadow by them on the plaza. Even within such a cropped frame, a morning sun angle—say, 10am—would likely show the entire plaza covered in shadow, triggering the implicit understanding by the viewer that something large is blocking the sun.
One will also note that View 02 is only image in the Rendering package with a point-of-view of a person standing at ground level…a perfect segue into our next technique.
CHOICE OF POINT-OF-VIEW
Part and parcel with choice of frame is the choice of point-of-view (POV). This is particularly critical for 3-dimensional imagery. Perspective images, in particular, have the unique option of choosing the eye level where the ‘camera’ image will be taken. These images mimic the way we perceive the world every day and the choice of eye level is significant insofar that it either adds or detracts from the viewer’s understanding of scale.
Simply put, images that show the eye level at the height of a person standing on the ground are the most generally comprehensible: allowing viewers to more-or-less accurately assess the scale and proportion of elements within the frame. Any deviation from this norm makes these associations less understandable, emphasizing and deemphasizing some things over others.
For example, an image with eye-level drawn at 1ft off the ground will exaggerate the height of a person or building—a common POV, often called an “upshot”, used to make subjects look imposing in movies or photographs. Conversely, an eye-level 100ft above grade will understate any meaningful scalar relationships between the human body and its surrounding elements since a person’s size is diminished against the environment. A person is effectively a speck or “ant” in the visual field.
As a broad rule of thumb, rendering packages for large developments that might spur community backlash due to bulk and height concerns bias perspectival visuals with a POV that positions eye level well above grade level. This serves to neutralize and minimize the scalar understanding of the project as experienced ‘at street level’, while focusing more on the visual quality of the larger environmental subject—that is, the building as a whole. These ‘helicopter’ views will never be experienced first-hand, yet they are truly the bulk of the renderings provided for public commentary and critique. This is the case for the most recent Perkins & Will Rendering package, only two of the eleven visuals provided are at street level (View 02 seen above and View 06) and both are framed to crop out the towers.
View 05 and View 07 below, by contrast, locates eye level at approx. 45ft and 97ft above street level, respectively. People are ant-sized, making it difficult to meaningfully assess the visual impact and scale of the development as one would experience if built. As such, accurately assessing any “refinements to the overall massing and form of development” and/or any height reduction is extremely challenging, if not impossible.
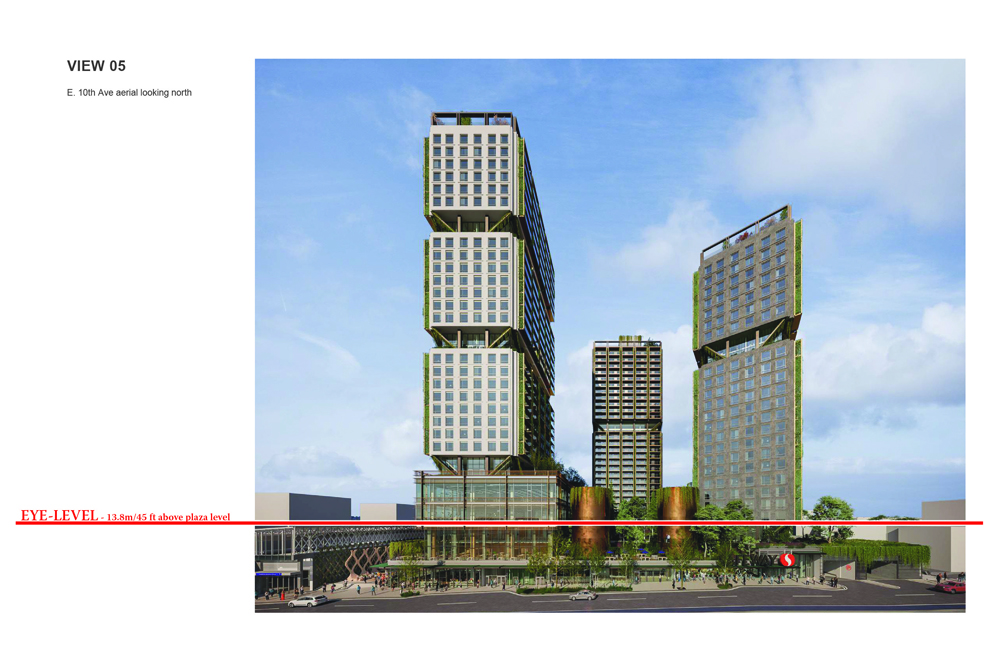
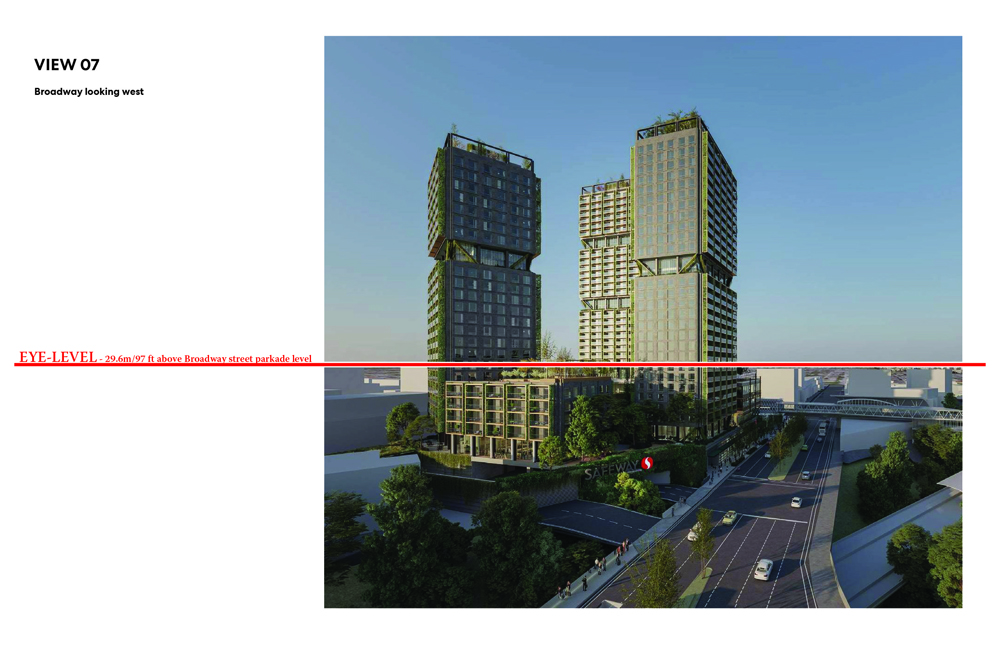
By not giving viewers the visual information required to make an informed decision about the scale and size of the project, the public is effectively coerced to ‘trust’ that the developer and designers are being truthful in their claims.
CHOICE OF CAMERA LENS/FIELD OF VIEW
Choice of framing and POV work alongside the choice of camera lens/field of view. The trio work towards creating a composition of an image—a technique we won’t, unfortunately, discuss at length in this article. Regardless, the choice of camera lens/field of view is a difficult technique to explain readily and as a means of making this more accessible, I will purposefully oversimplify.
Camera lens/field of view choice dictates the amount of visual distortion inherent to an image. Most people are aware of the fisheye lens, for example, that radically distorts the visual field to widen the angle of view and looks spherical—creating an image very different than our normal experience.
Different than even a decade ago, contemporary architectural rendering software allows visualizers to choose virtually any camera lens/field of view, giving them more control around what lies within a frame. Pre-computers only the most talented drawers had the technical savvy to create images with radical distortions—the reason why folks like M.C. Escher, with his spherical drawings, were so few and far between. Now anybody with minimal architectural software knowledge can distort the field of view of an image with the click of a button…and many do without thinking about the implications on graphic ‘accuracy’ and ‘truthfulness’.
Broadly speaking, in any distorted perspective image, the distortion increases as one moves away from the central focus of the image. Thus, the telltale sign of image tampering is most evident towards its edges. To compensate, when the distortion is extreme, architectural visualizers typically omit elements along the edges of an image to make it look more ‘normal’.
I focused quite a bit on visual distortions in my first piece: speaking quickly to the fact that the south perspective—View 01 in the previous package—is an ‘impossible view’ due to its distortion. This distortion is even more evident in View 05 of the most recent package below. So much so that the existing Medical Building (1750 E 10th Ave) and three single-family residences that are in front of the proposal are intentionally omitted by the creator(s) of this image through the choice of the frame that crops out the ground across the street of the proposal.
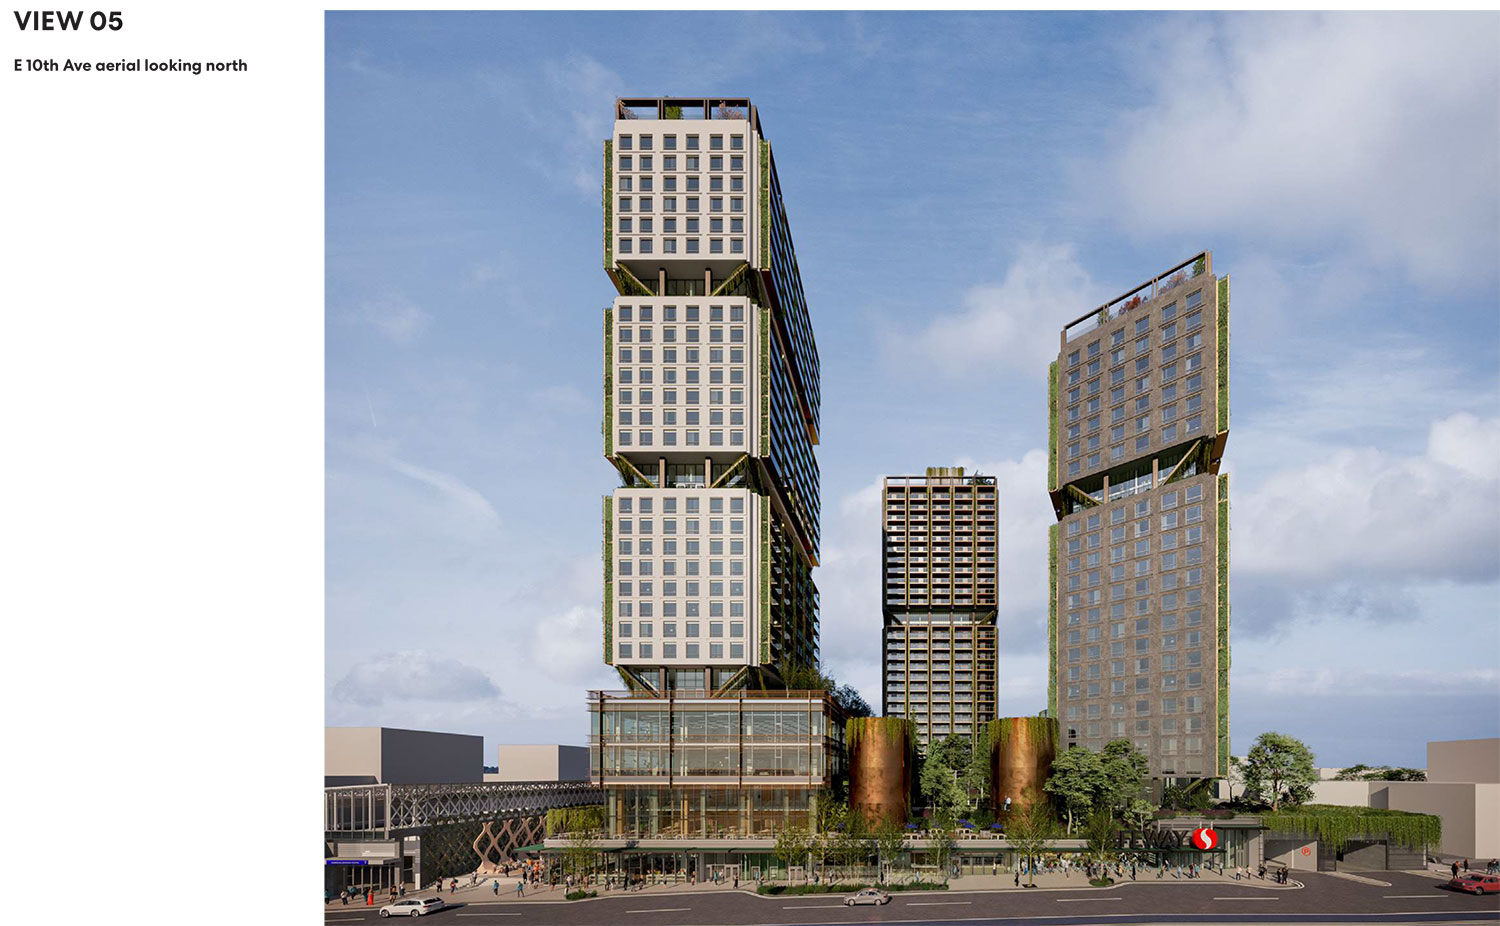
Still, the upper floors of the Medical Building should still be visible at the bottom right corner of View 05, roughly within the red-filled shape below. The distortion in the image is so great, however, that putting the building in accurately would require more work than necessary to simply demonstrate the misrepresentation present in the image.
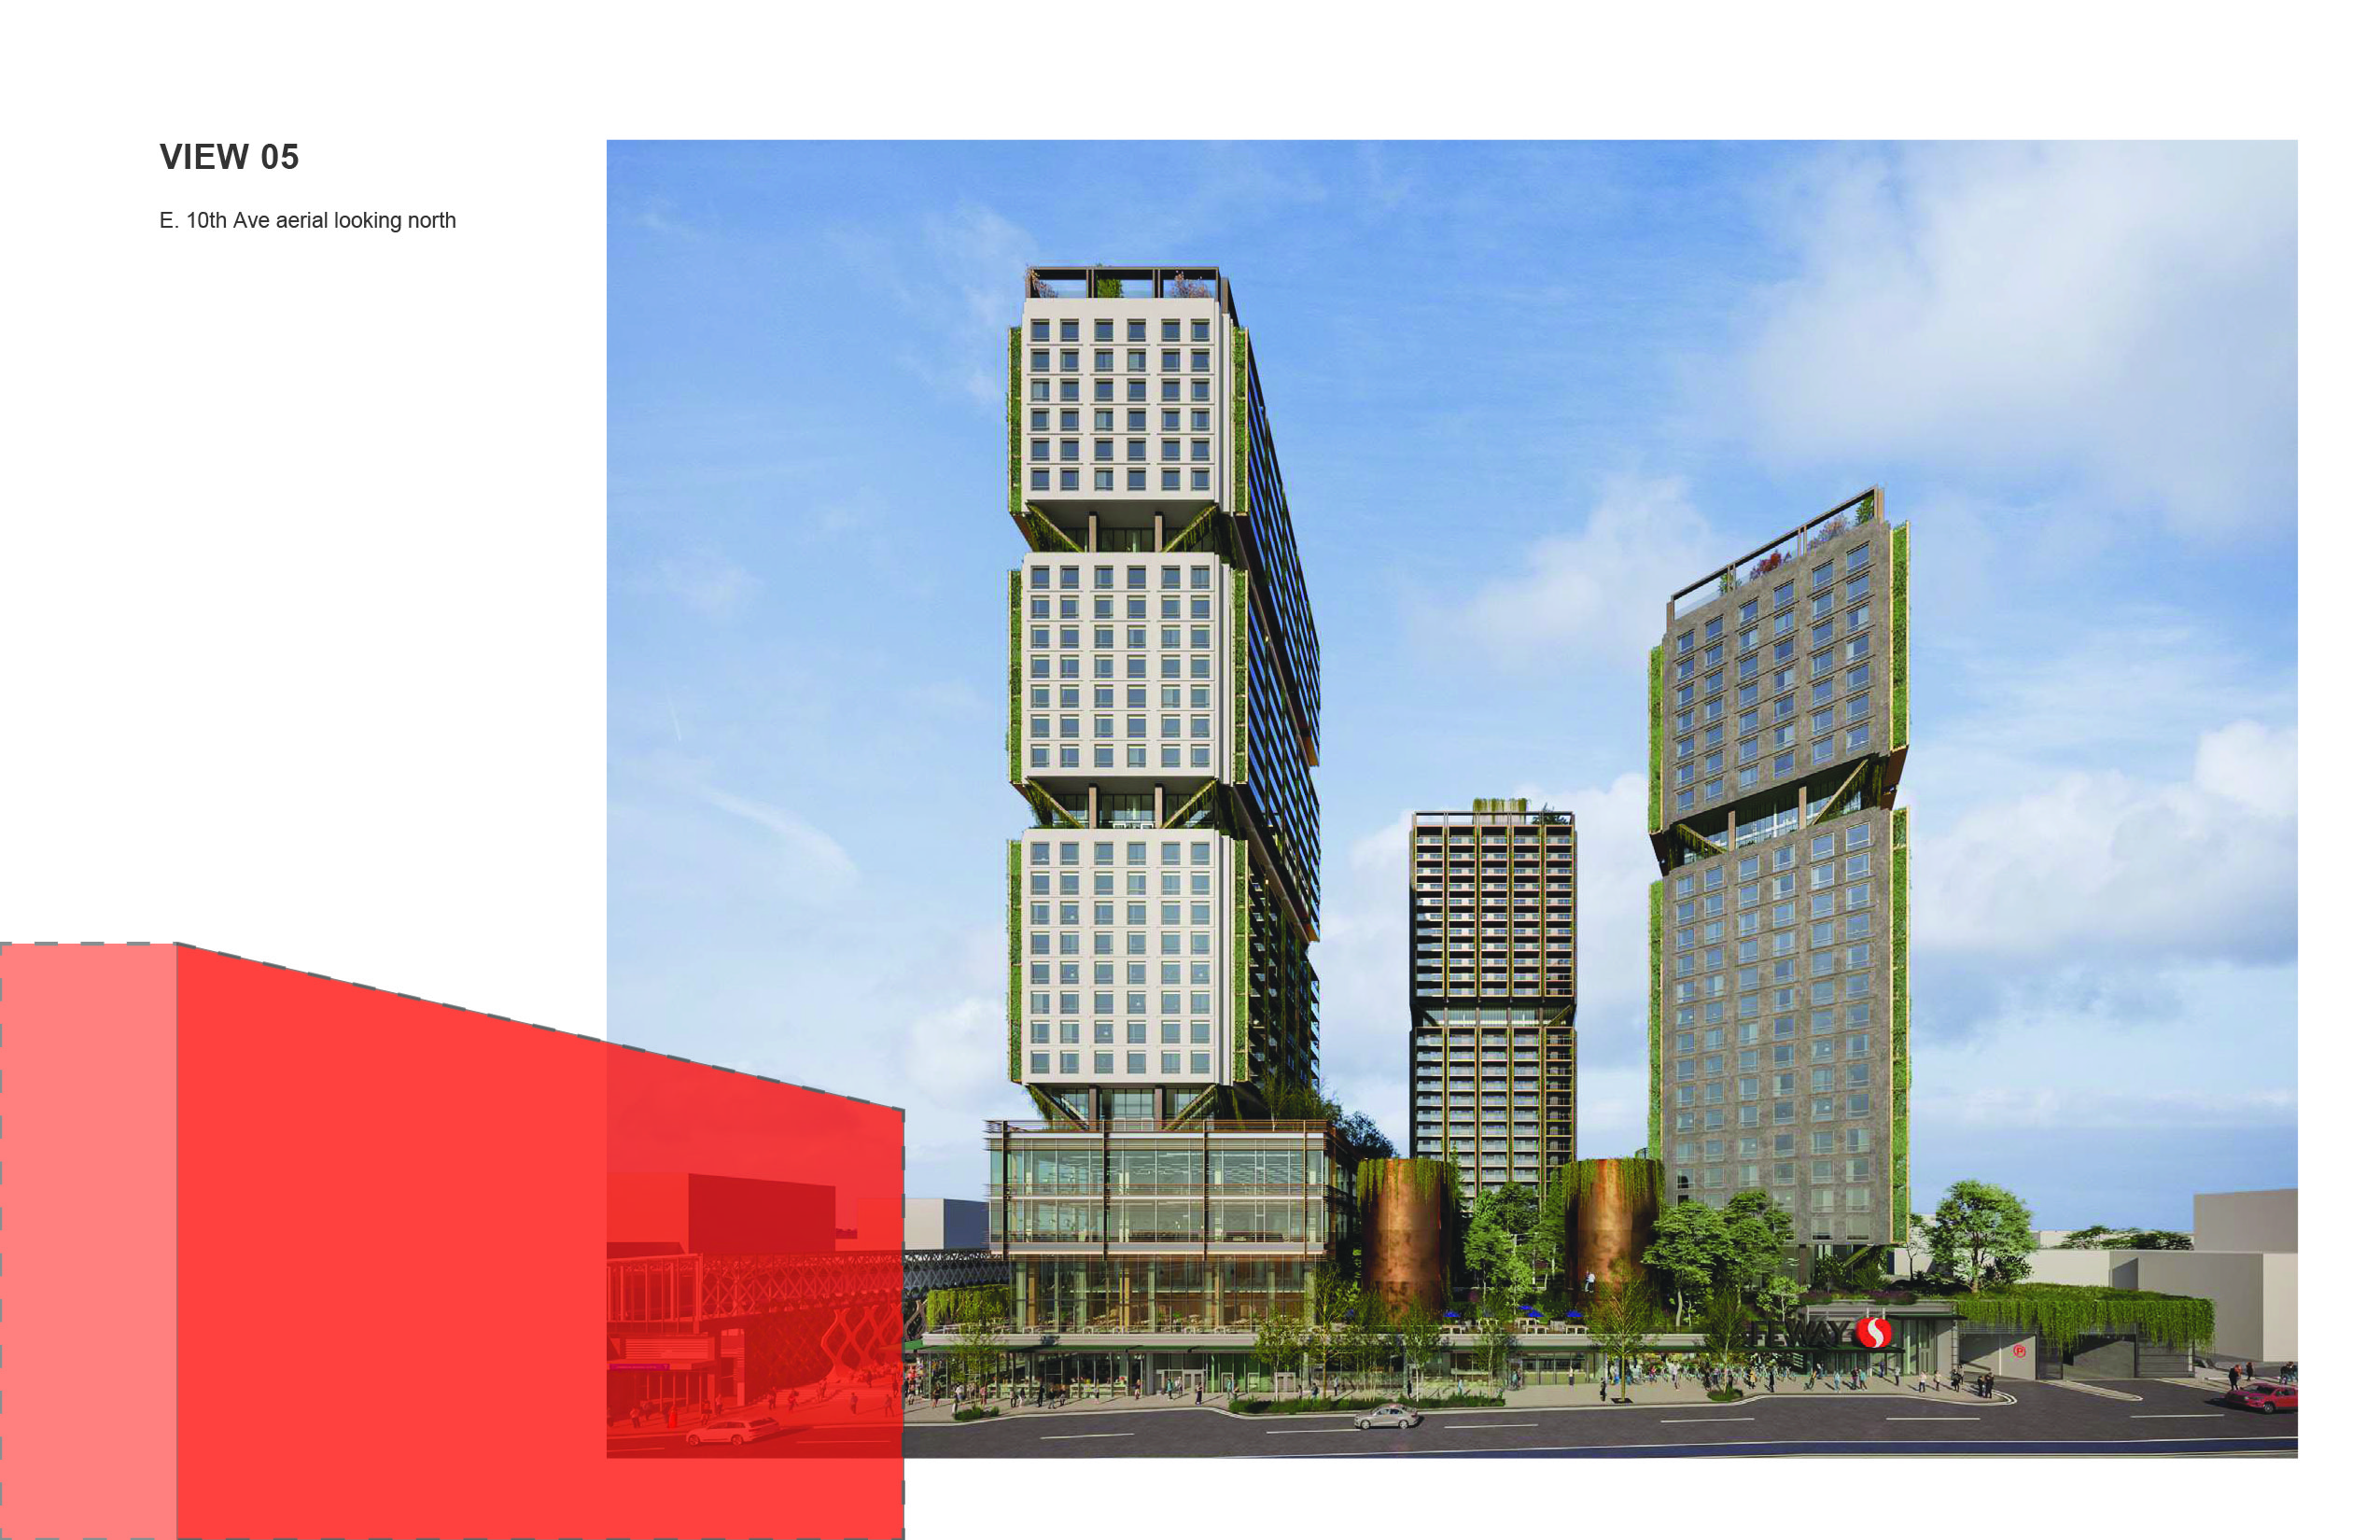
The result of this choice of camera lens/field of view—in conjunction with other techniques—makes the (private) central courtyard between the buildings its focus. The courtyard is the most proportionally accurate element in the image, with the tower proportions getting more distorted moving radially away from it. This makes accurately assessing any “refinements to the overall massing and form of development” and/or height reduction of the towers virtually impossible as they are more distorted the higher they are in the image.
COMPARISONS
The final aspect we’ll discuss is less a visualization technique than a principle for graphic integrity. The implicit yet fundamental reason behind presenting this new option to the public is comparative—that is, it argues for ‘positive’ revisions made relative to the initial proposal and one can only judge the ‘truthfulness’ of the changes based on comparison with the last option. Yet, there is no visual evidence readily comparing the options and thus the validity of the claims remains abstract—one is simply asked to take the written revisions for face value, without question.
Let’s look more closely at the “Increased area for the public plaza” claim, for example. Below is the floor plan from the most recent graphic package with the plaza along the left side.
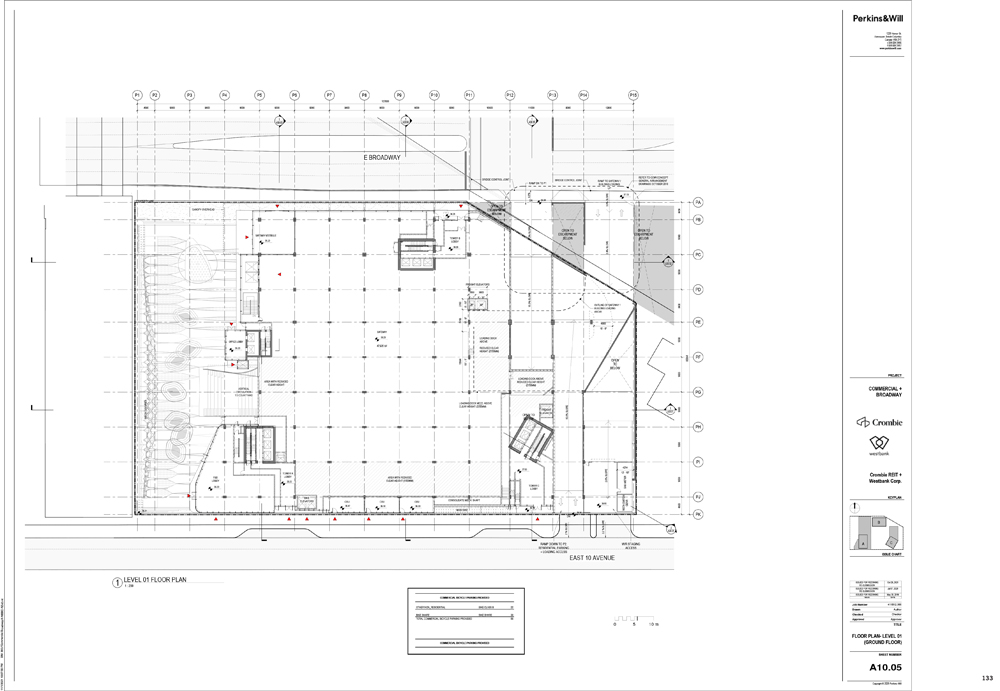
How do we know it has increased, and by how much?
Below we see the above with overlay of the original plaza. The green dashed areas effectively cancel each other out, so the only additional area is depicted in solid red: an area amounting to roughly an additional 68 sq. meters/730 sq.ft, less than the main level of a standard single-family house….and at least 100sq.ft of that is unusable since it lies in front of a double door entry.
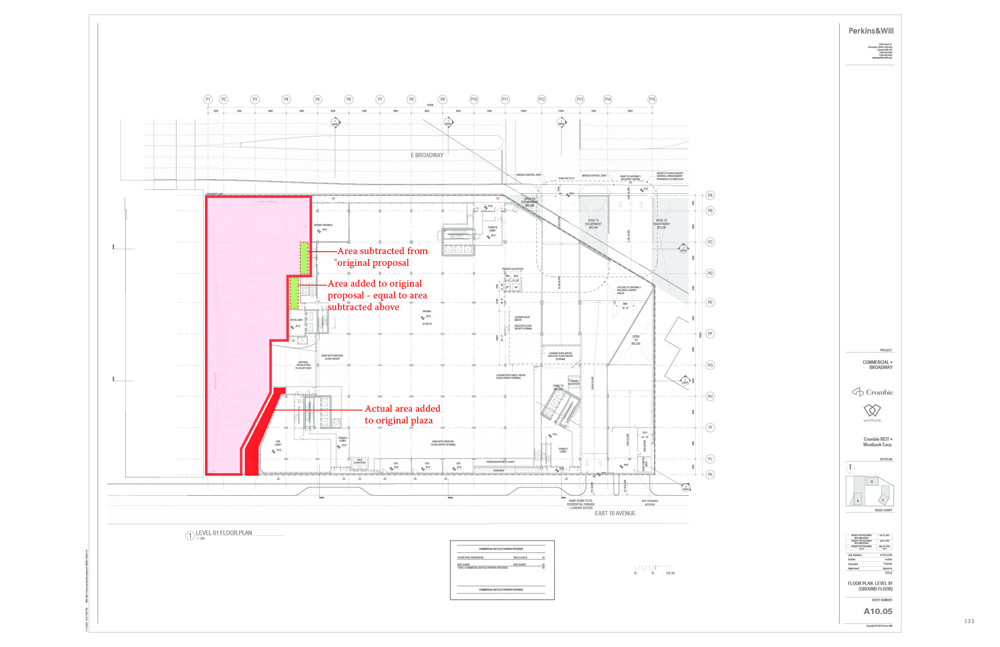
So, the public plaza has in fact increased, but not by a significant amount. The question of what, if anything, was given to the developer in return for this marginal area is an important one. But perhaps even more significant: should there be a minimum criteria required for developers to claim an “increase” for public approval? If Perkins & Will added an extra 2 sq.ft of area to the plaza, does this give them the authority to legitimately claim an ‘increase’?
The reduction in height claim is even more problematic. In the design field, there is no set height defining a “storey”. Although there is a general range, the specifics change based on use and context. Thus, a building can increase in height while having fewer storeys. This should raise suspicion around the “Reduction of building height by one-storey on each of the residential towers” claim, given that storey height and building height are separate issues.
Visual evidence is necessary, so let’s look more closely into the issue. The following depicts the north elevation of the newest proposal.

The image below overlays the previous proposal’s north elevation outline to the top of the “roof level” (not the “screens”). As one can see, there is minimal difference in building height.
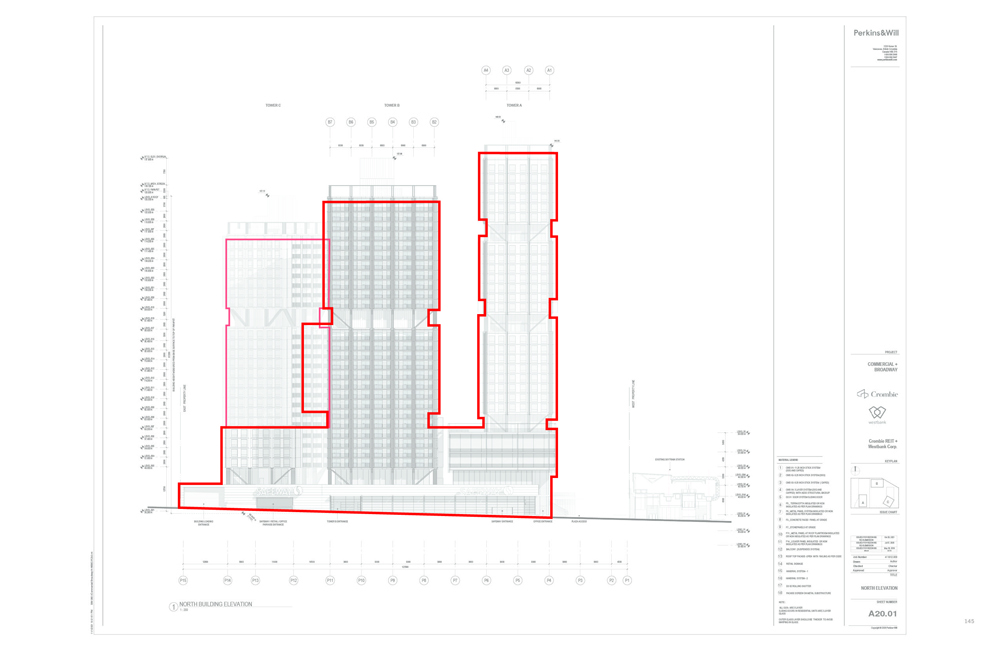
Cross-referencing the height numbers within the visuals package, below are the actual height comparisons:
- Tower A Roof: Previous option = 103.1m / Current Option = 102.3m
- Tower B Roof: Previous option = 89.25m / Current Option = 90.05m
- Tower C Roof: Previous option = 78.45m / Current Option = 78.15m
As you can see, Towers A and Tower C are under a meter shorter, while Tower B is actually higher than the original, albeit by a margin amount. As mentioned, this is to the top of the roof level. If one takes into account the small mechanical rooms (labeled “Overrun” on the drawing) at the top of each tower, which have implications on cast shadows, all towers are in fact higher than the previous proposal.
Once again, this should bring to mind questions around whether there should be some minimum criteria for claims made for revisions for public approval. In the absence of visual evidence, the public is asked to assume truthfulness while developers and their graphic-savvy employees take advantage of this trust.
BY WAY OF CONCLUSIONS
I ended the original Deconstructing Visuals with a call for “visuals ethics” and described five things that I believed would get us started towards that end—Recognizing the limits of vision and visual media, Holding Visualizers Accountable, Making Assumption Explicit, Visualization Education in Planning, and the creation of Communal City 3d Model accessible to the public.
To those five I will add one more particularly relevant to planning processes and the discussion above:
Making comparisons visually evident—As we have seen, developers and their designers take full advantage of the public’s inability to make comparisons across design options, some of which are done months or years apart. This is often achieved by outlining written ‘bullets’ of the revisions without any clear visual evidence to validate their claims. Under these circumstances, the public—as mentioned—is expected to assume truthfulness, allowing developers to take advantage of the situation.
Ultimately, I remain steadfast in my belief that the visuals used in public processes need to be regulated given the rate at which they are becoming more convincing and the increased savviness of those manipulating them. That the Perkins & Will team working on this project (and their associated Westbank and Crombie REIT employers) would be so bold as to misrepresent their work to the public again despite marked criticism shows a lack of integrity and should truly be a warning sign for the public and municipality. Fool me once…
***
You can the original Deconstructing Visuals here.
**
To find out more information about 1780 East Broadway and access all the visual materials, visit the City of Vancouver website.
**
Erick Villagomez is the Editor-in-Chief at Spacing Vancouver and the author of The Laws of Settlements: 54 Laws Underlying Settlements across Scale and Culture. He is also an educator, independent researcher, and designer with personal and professional interests in urban landscapes. His private practice–Metis Design|Build–is an innovative practice dedicated to a collaborative and ecologically responsible approach to the design and construction of places. He also teaches architectural drawing, rendering and visualization…and is an avid drawer and painter. You can see more of his artwork on his Visual Thoughts Tumblr and follow him on his instagram account: @e_vill1.