
![]()
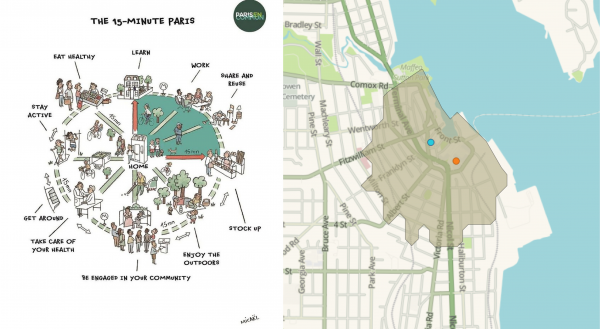
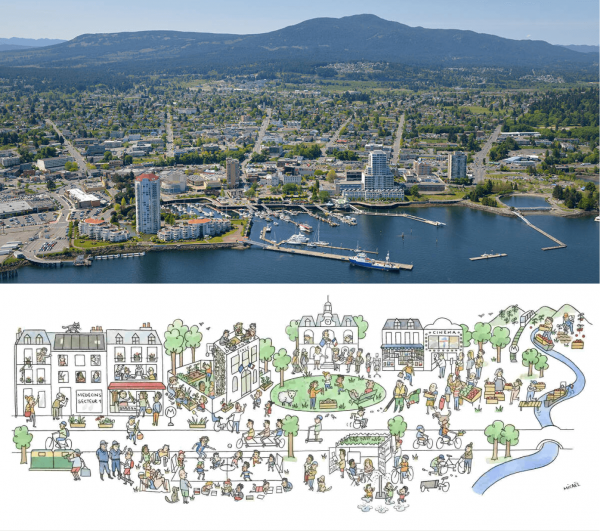
Carlos Moreno’s “15-minute city” has been promoted by many city mayors around the world – perhaps most famously Parisian mayor Anne Hidalgo. In Moreno’s ideal city, everyone lives within 15 minutes walk, bicycle, or public transit of everything they need to eat, drink, work, and play. In 2021, when I heard that the City of Nanaimo – a sprawling, car-dependent city – was touting the idea of a 15-minute Nanaimo, I was skeptical.
Let’s put some numbers on this
Sure, promotional renderings of sunny, tree-lined, amenity-rich and pedestrian-friendly 15-minute streetscapes could be drawn up. But wasn’t it obvious that a town with Walk, Bike, and Public Transit Scores in the mid-30s (Vancouver’s are in the 80s) was nowhere near the 15-minute (15:) ideal? Still, I couldn’t say just how far Nanaimo was from being a 15: city. Were there some neighbourhoods that were closer to that ideal? Finally, if there were 15: neighbourhoods, who could afford to live in them? Quantitative answers to these questions could inform city officials and residents in discussing what has become an increasingly polarizing idea.
How to do it
I ran my thoughts by some friends, who suggested working backwards. First, create a list of “essential” amenity locations—grocery markets, pharmacies, parks, schools, and so on. Then, map these amenities’ 15: zones. Finally, look at where these zones overlap.
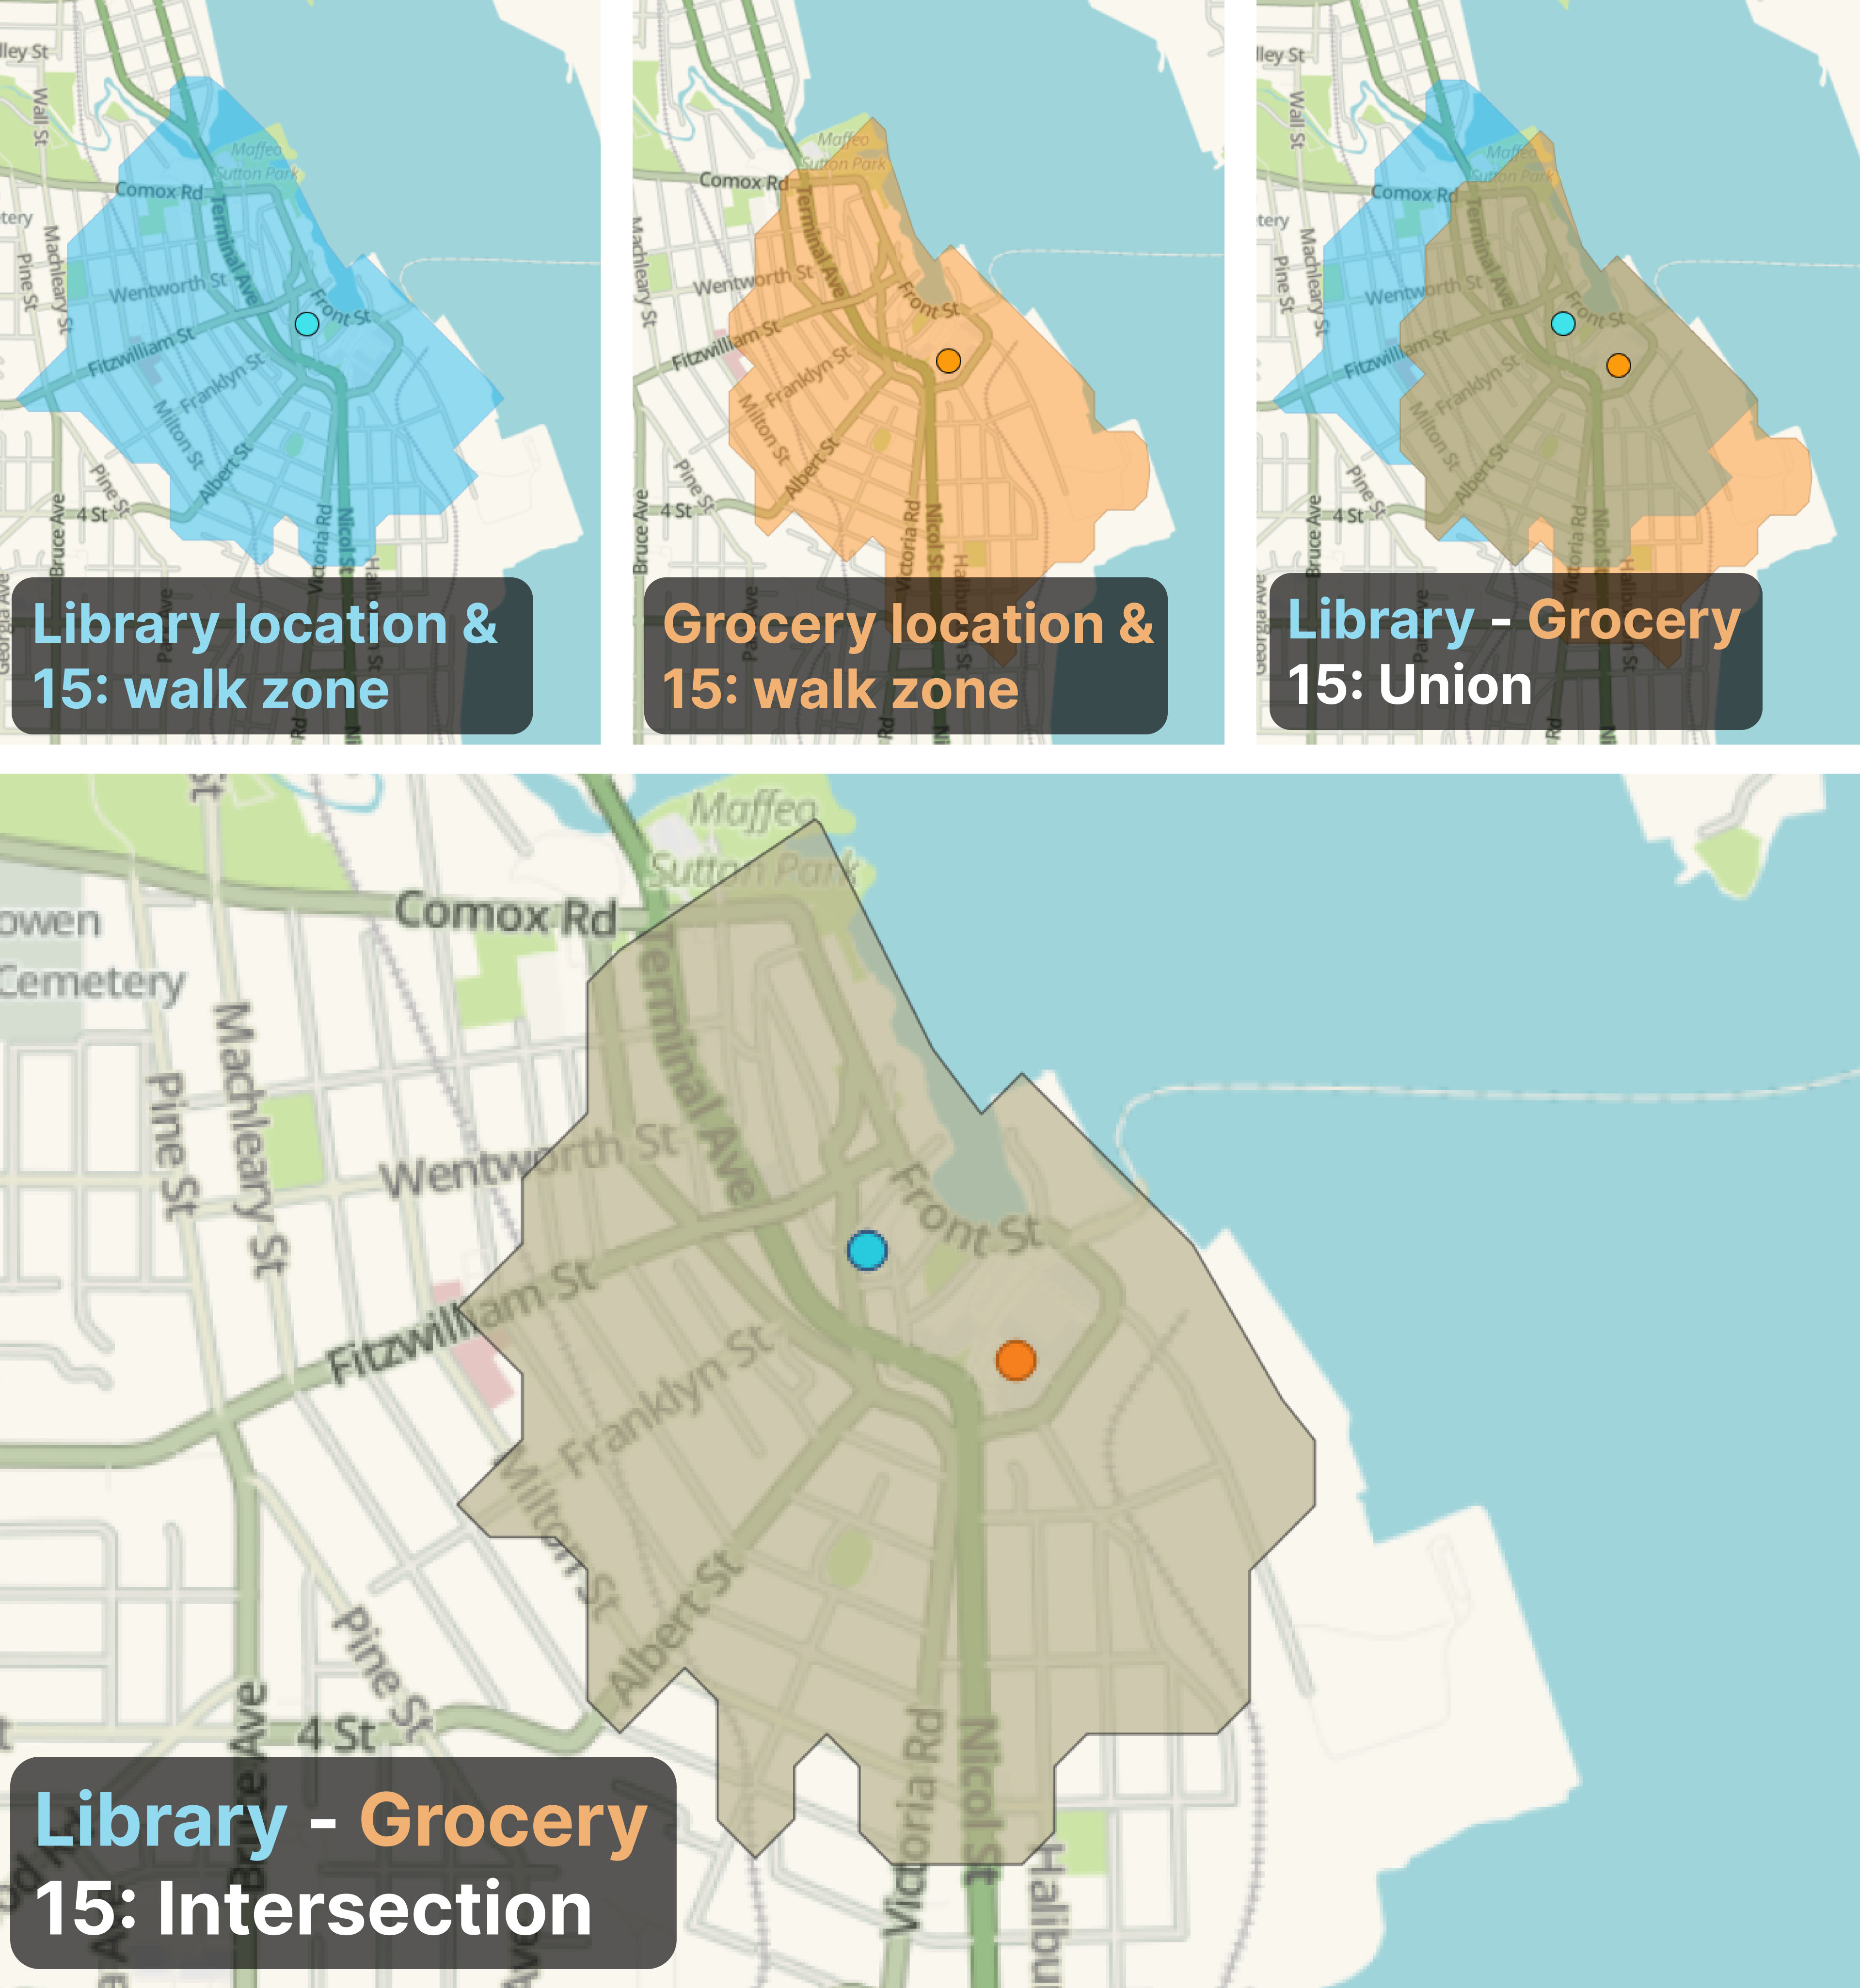
These overlapping amenity-access zones would define 15: neighbourhoods. To understand just how many people can live in and enjoy a 15: city, overlay your 15: zones on a population density map. And to get a rough idea of who can afford to live in these 15: zones, superimpose your 15: maps on a median household income map.
Carlos Moreno’s “chrono-urbanism” includes cycling and public transit in its 15-minute transport modes. But to keep things simple, I looked only at walking—the most generally accessible, affordable way of getting around. I based my “essential” amenities (shelter, medical care, grocery, and pharmacy) and “basic quality of life” amenities (recreational space, library, museum/gallery/theater/cinema, restaurant/pub, and cafe/coffee) on a Canada gov doc, geolocated them with Apify google maps scraper, mapped and isochrone-zoned using QGIS, and remapped in ArcGIS to overlay amenity 15: zones on median income household data and population density.
Here’s what I found
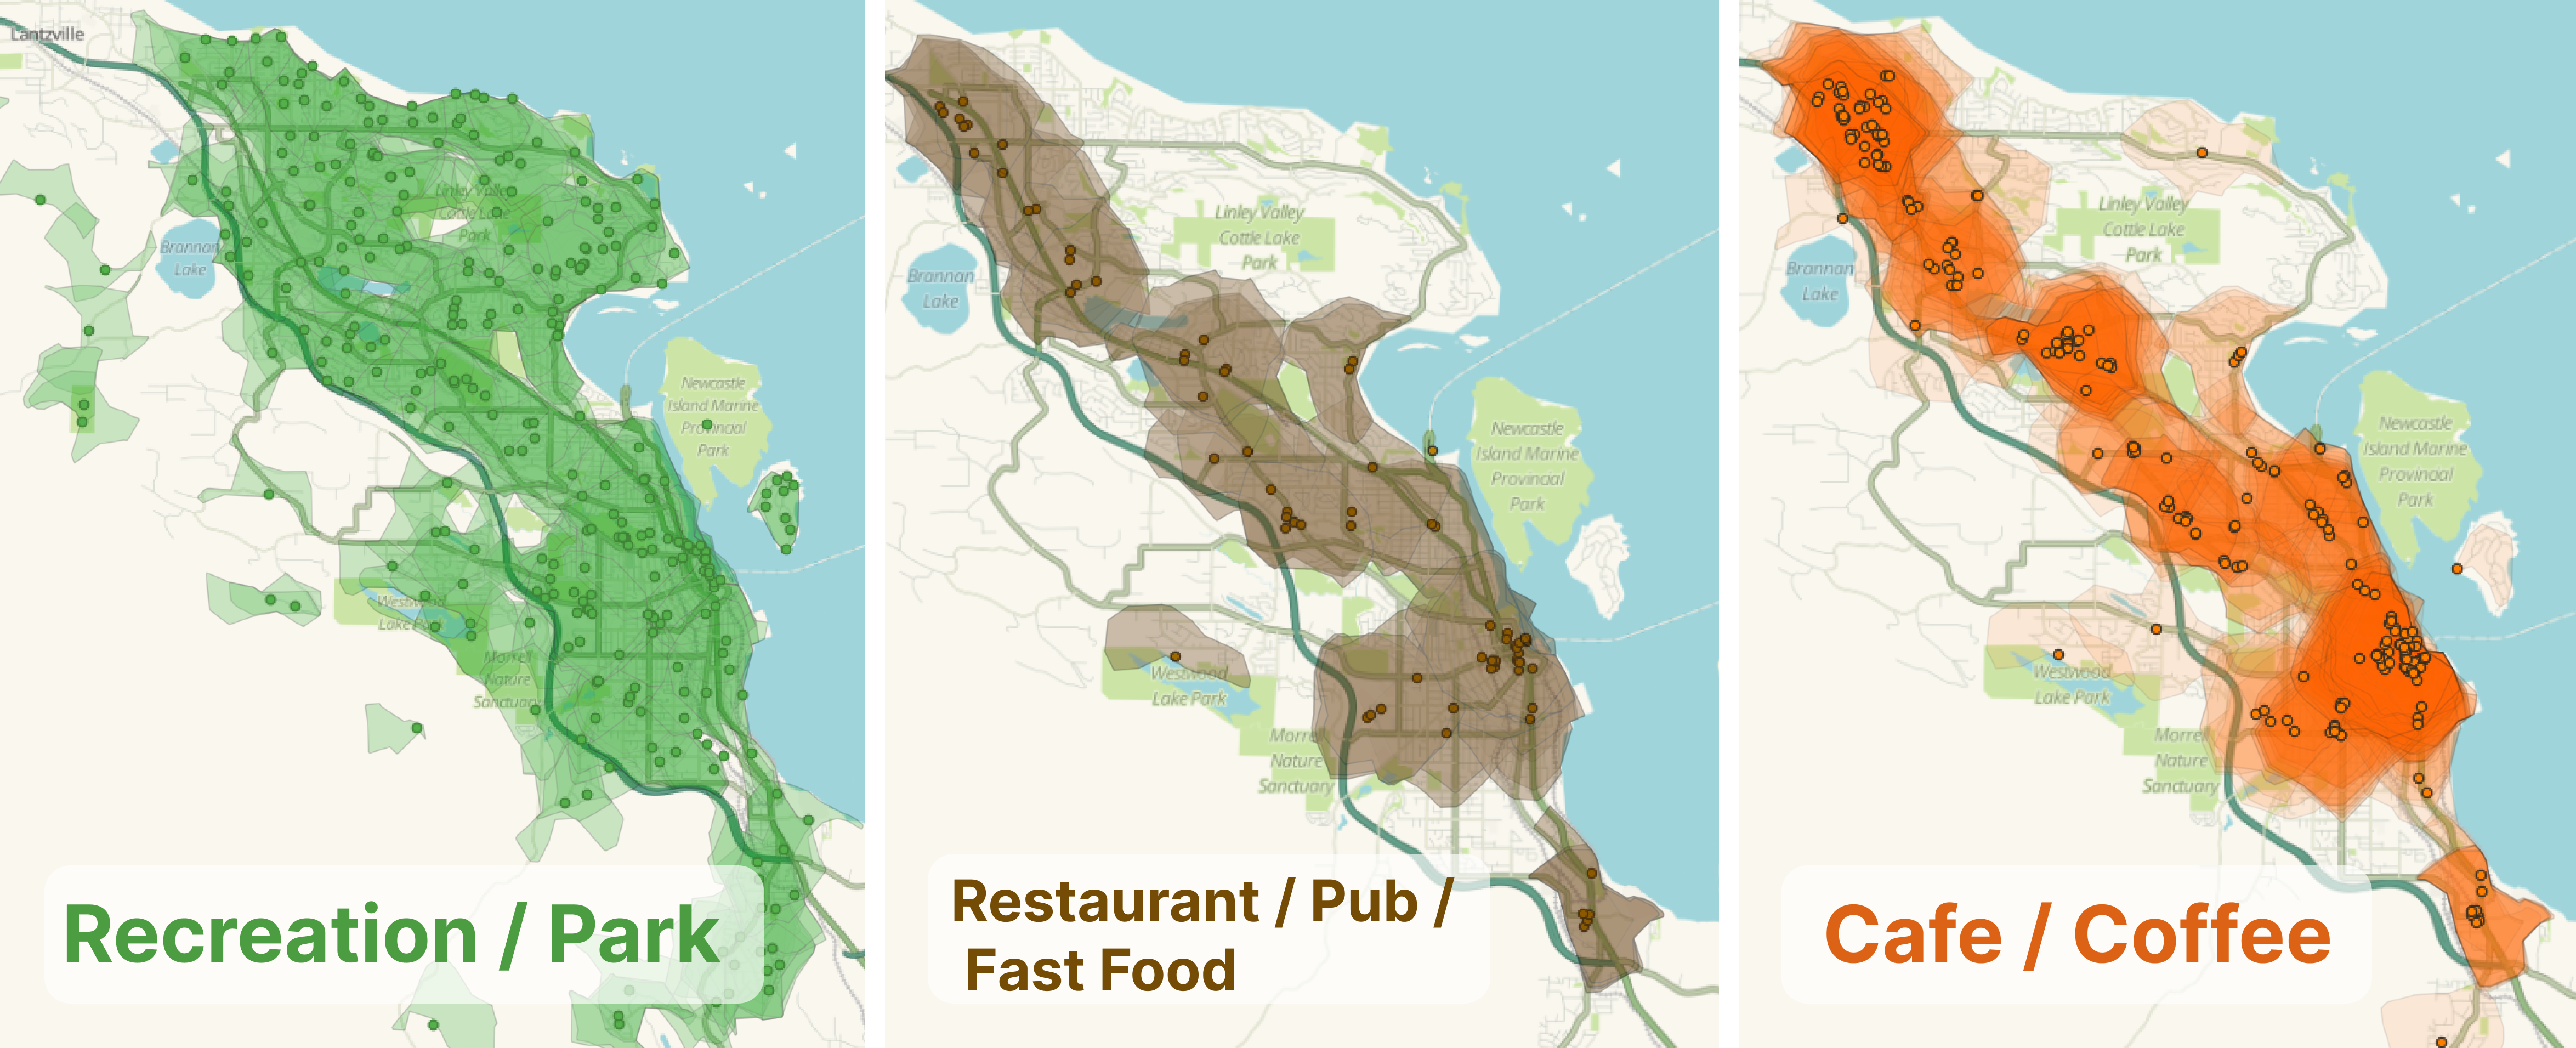
Some amenities are widespread. Virtually everyone in Nanaimo lives within 15 minutes walk of a recreational space or park, and most also enjoy 15: walking access to a restaurant, pub, fast food, and a cafe/coffee. Darker spots are amenities, surrounded by their 15: walk zones.
But not all amenities are in equal supply; in order of decreasing availability: the next four maps are of residences within 15: walk of museums/galleries/theatres/cinemas, groceries/supermarkets, pharmacies, and libraries.
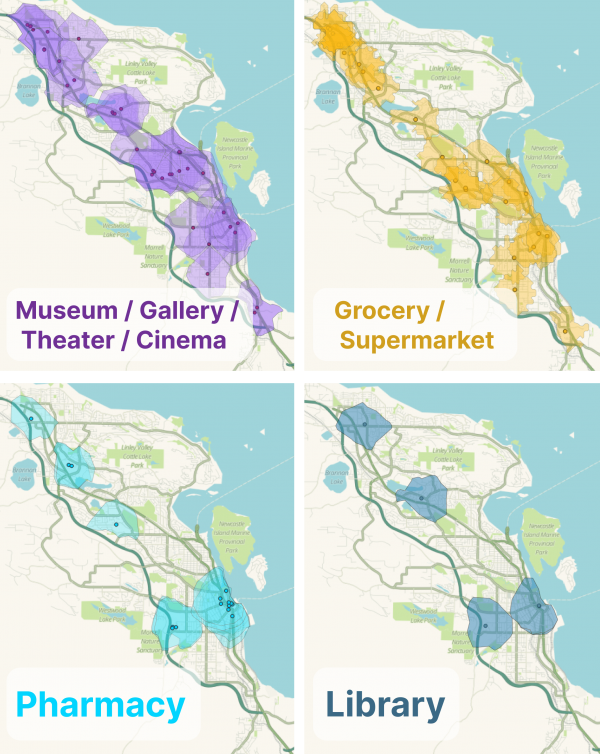
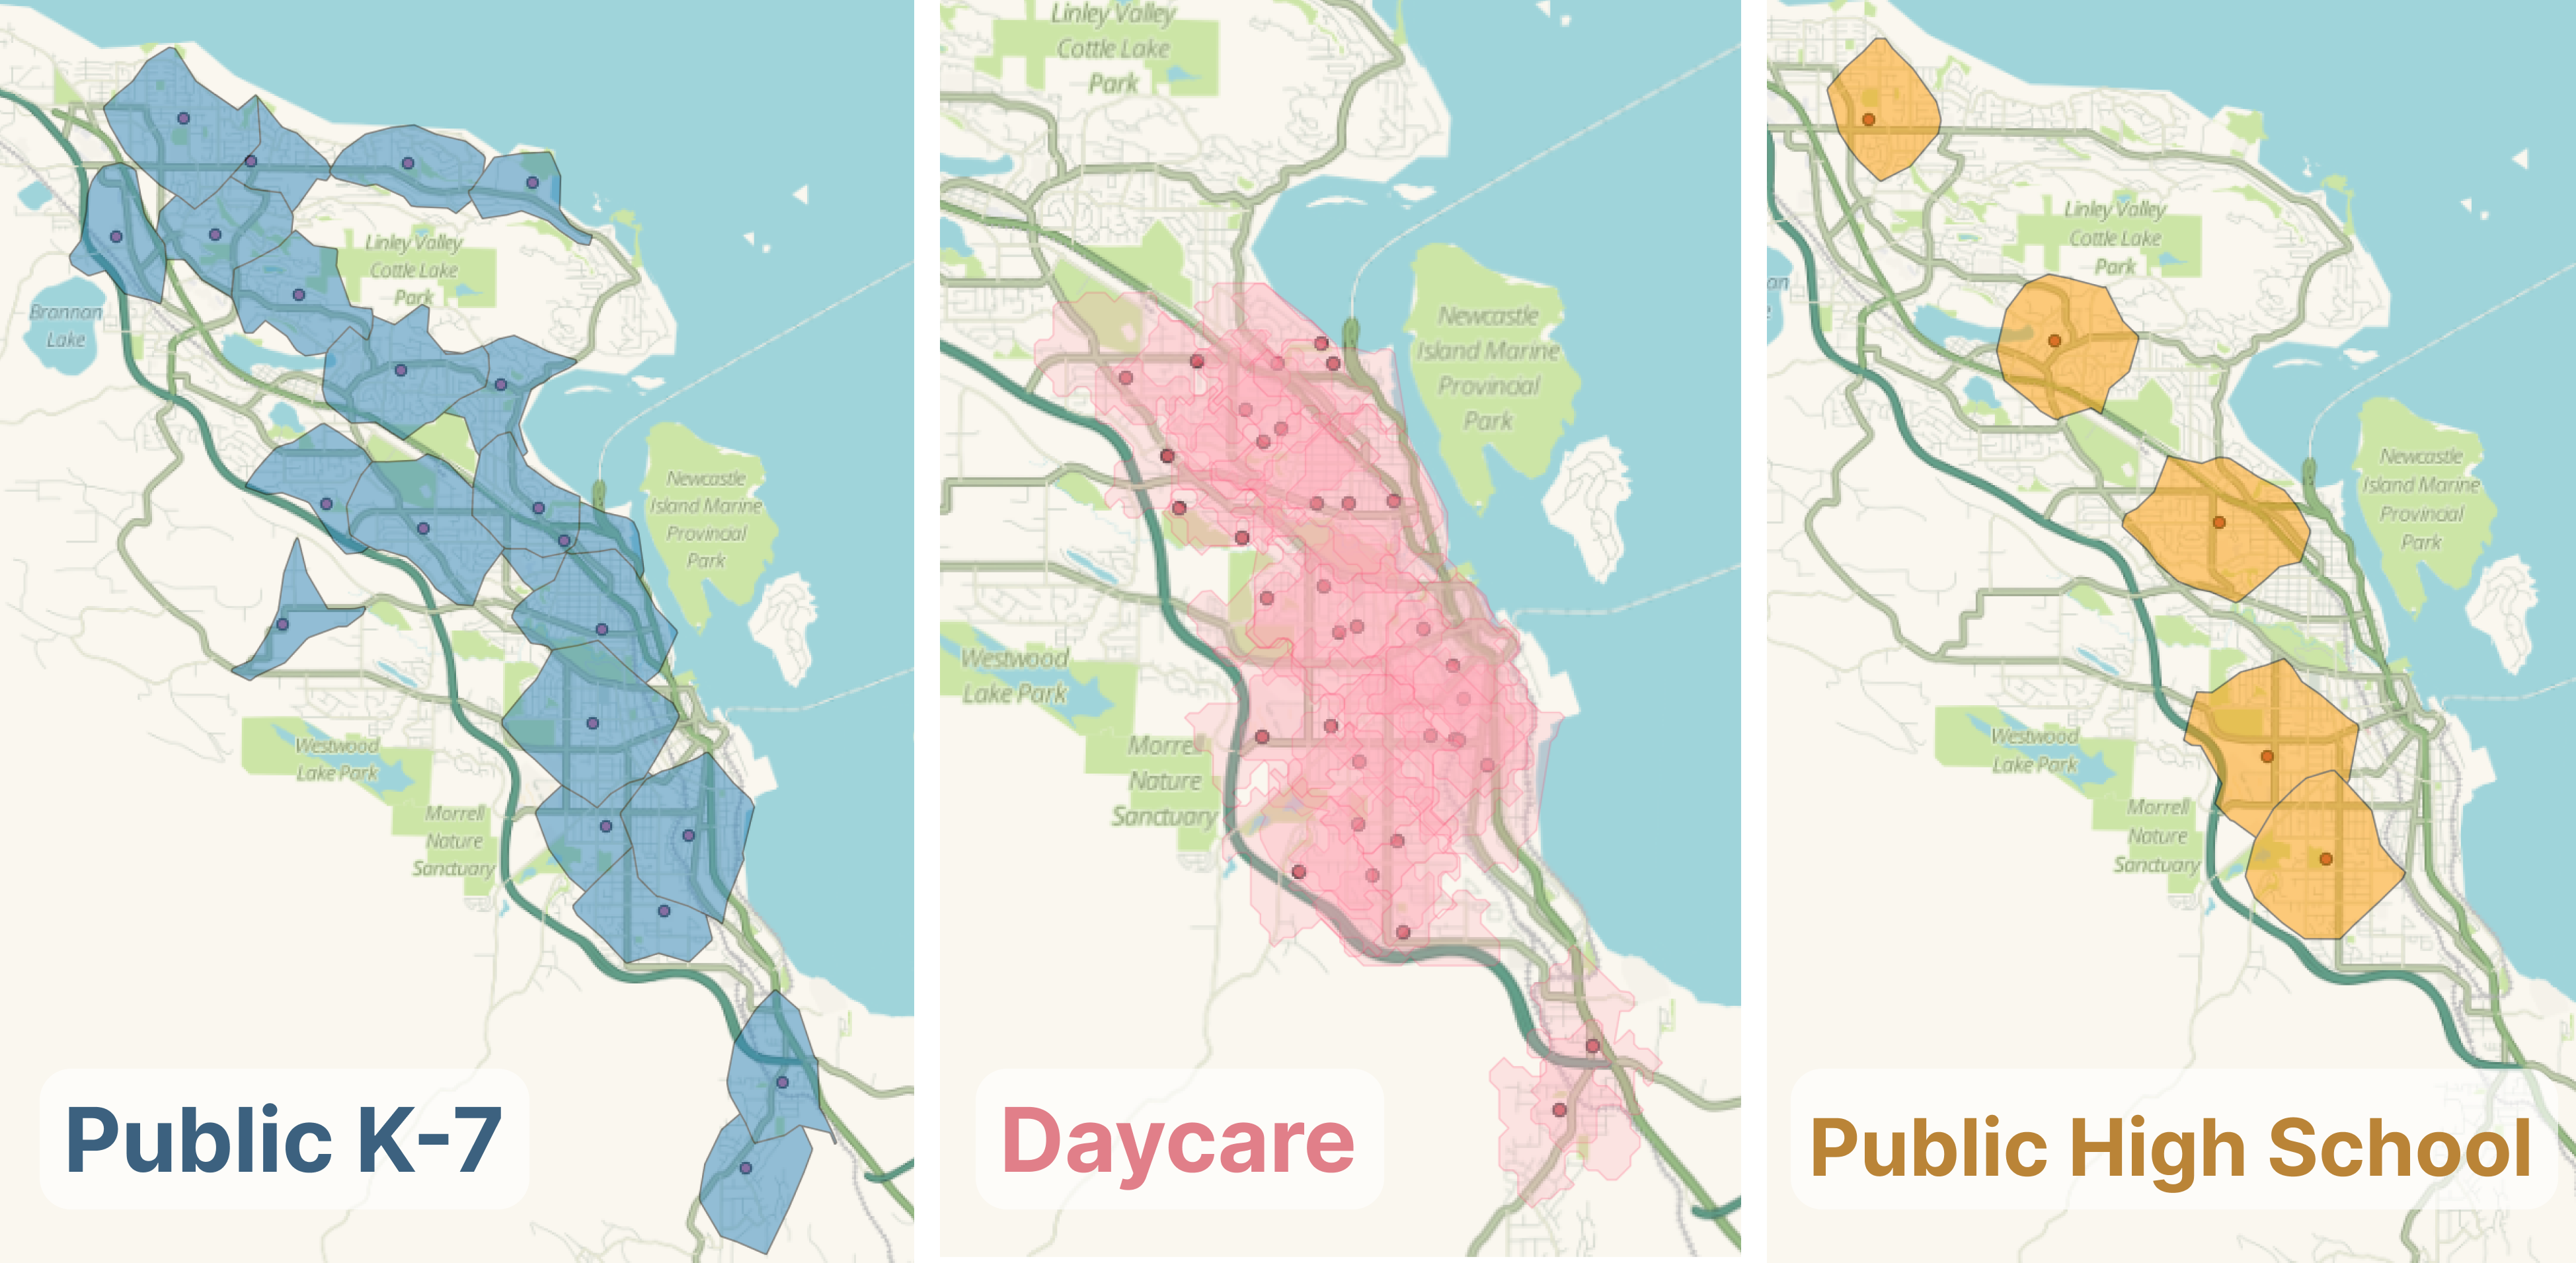
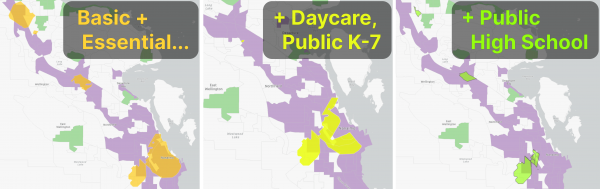
Also, in decreasing order of abundance, here are the 15: walk zones of public K-7, daycares, and high schools:
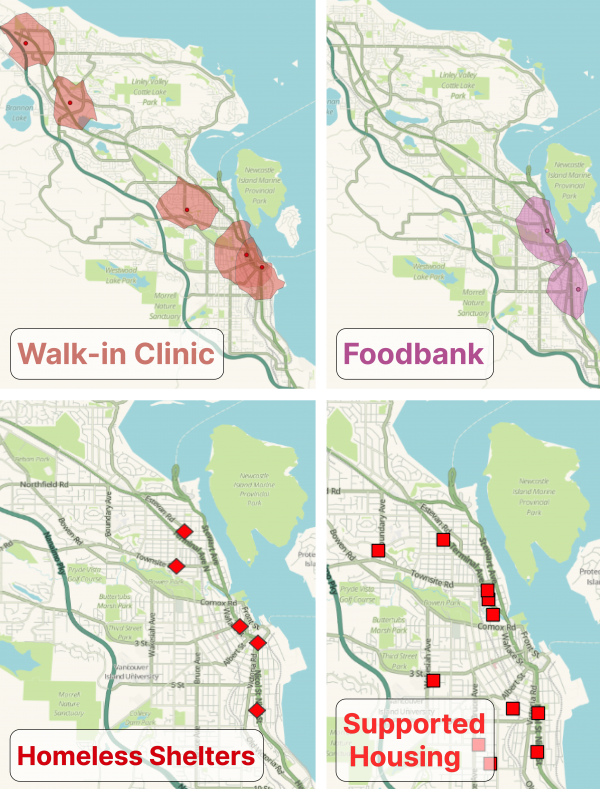
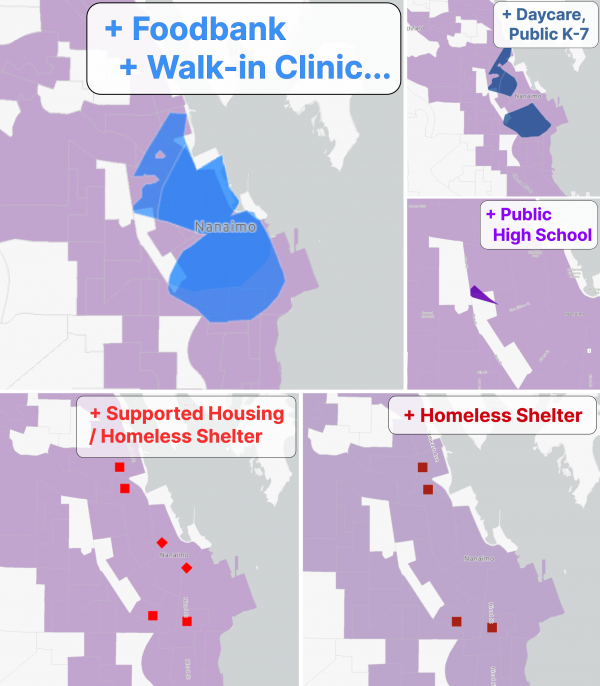
Other “support” amenities—walk-in clinics, food banks, supportive housing, homeless shelters—are much less widespread.
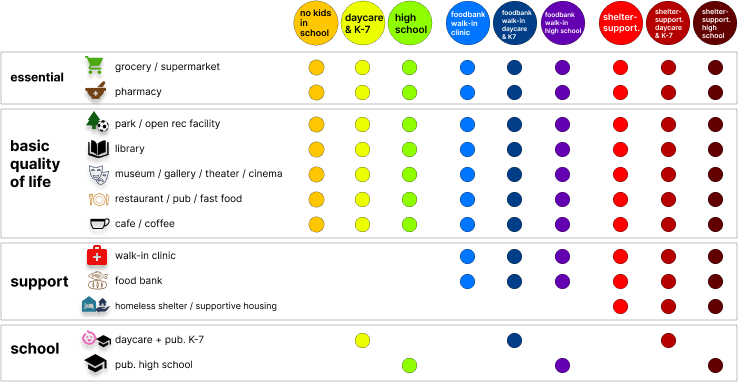
I assumed that everyone needs essential and basic quality-of-life amenities. Beyond that, different groups start to emerge: people with kids in daycare or K-7, or high school; people who need access to a walk-in clinic, or a food bank; and people who need supportive housing, or perhaps a homeless shelter.
Different People, Different Needs
Which group you belong to determines where you can live with 15: walking access to everything you need.
Let’s take a look:

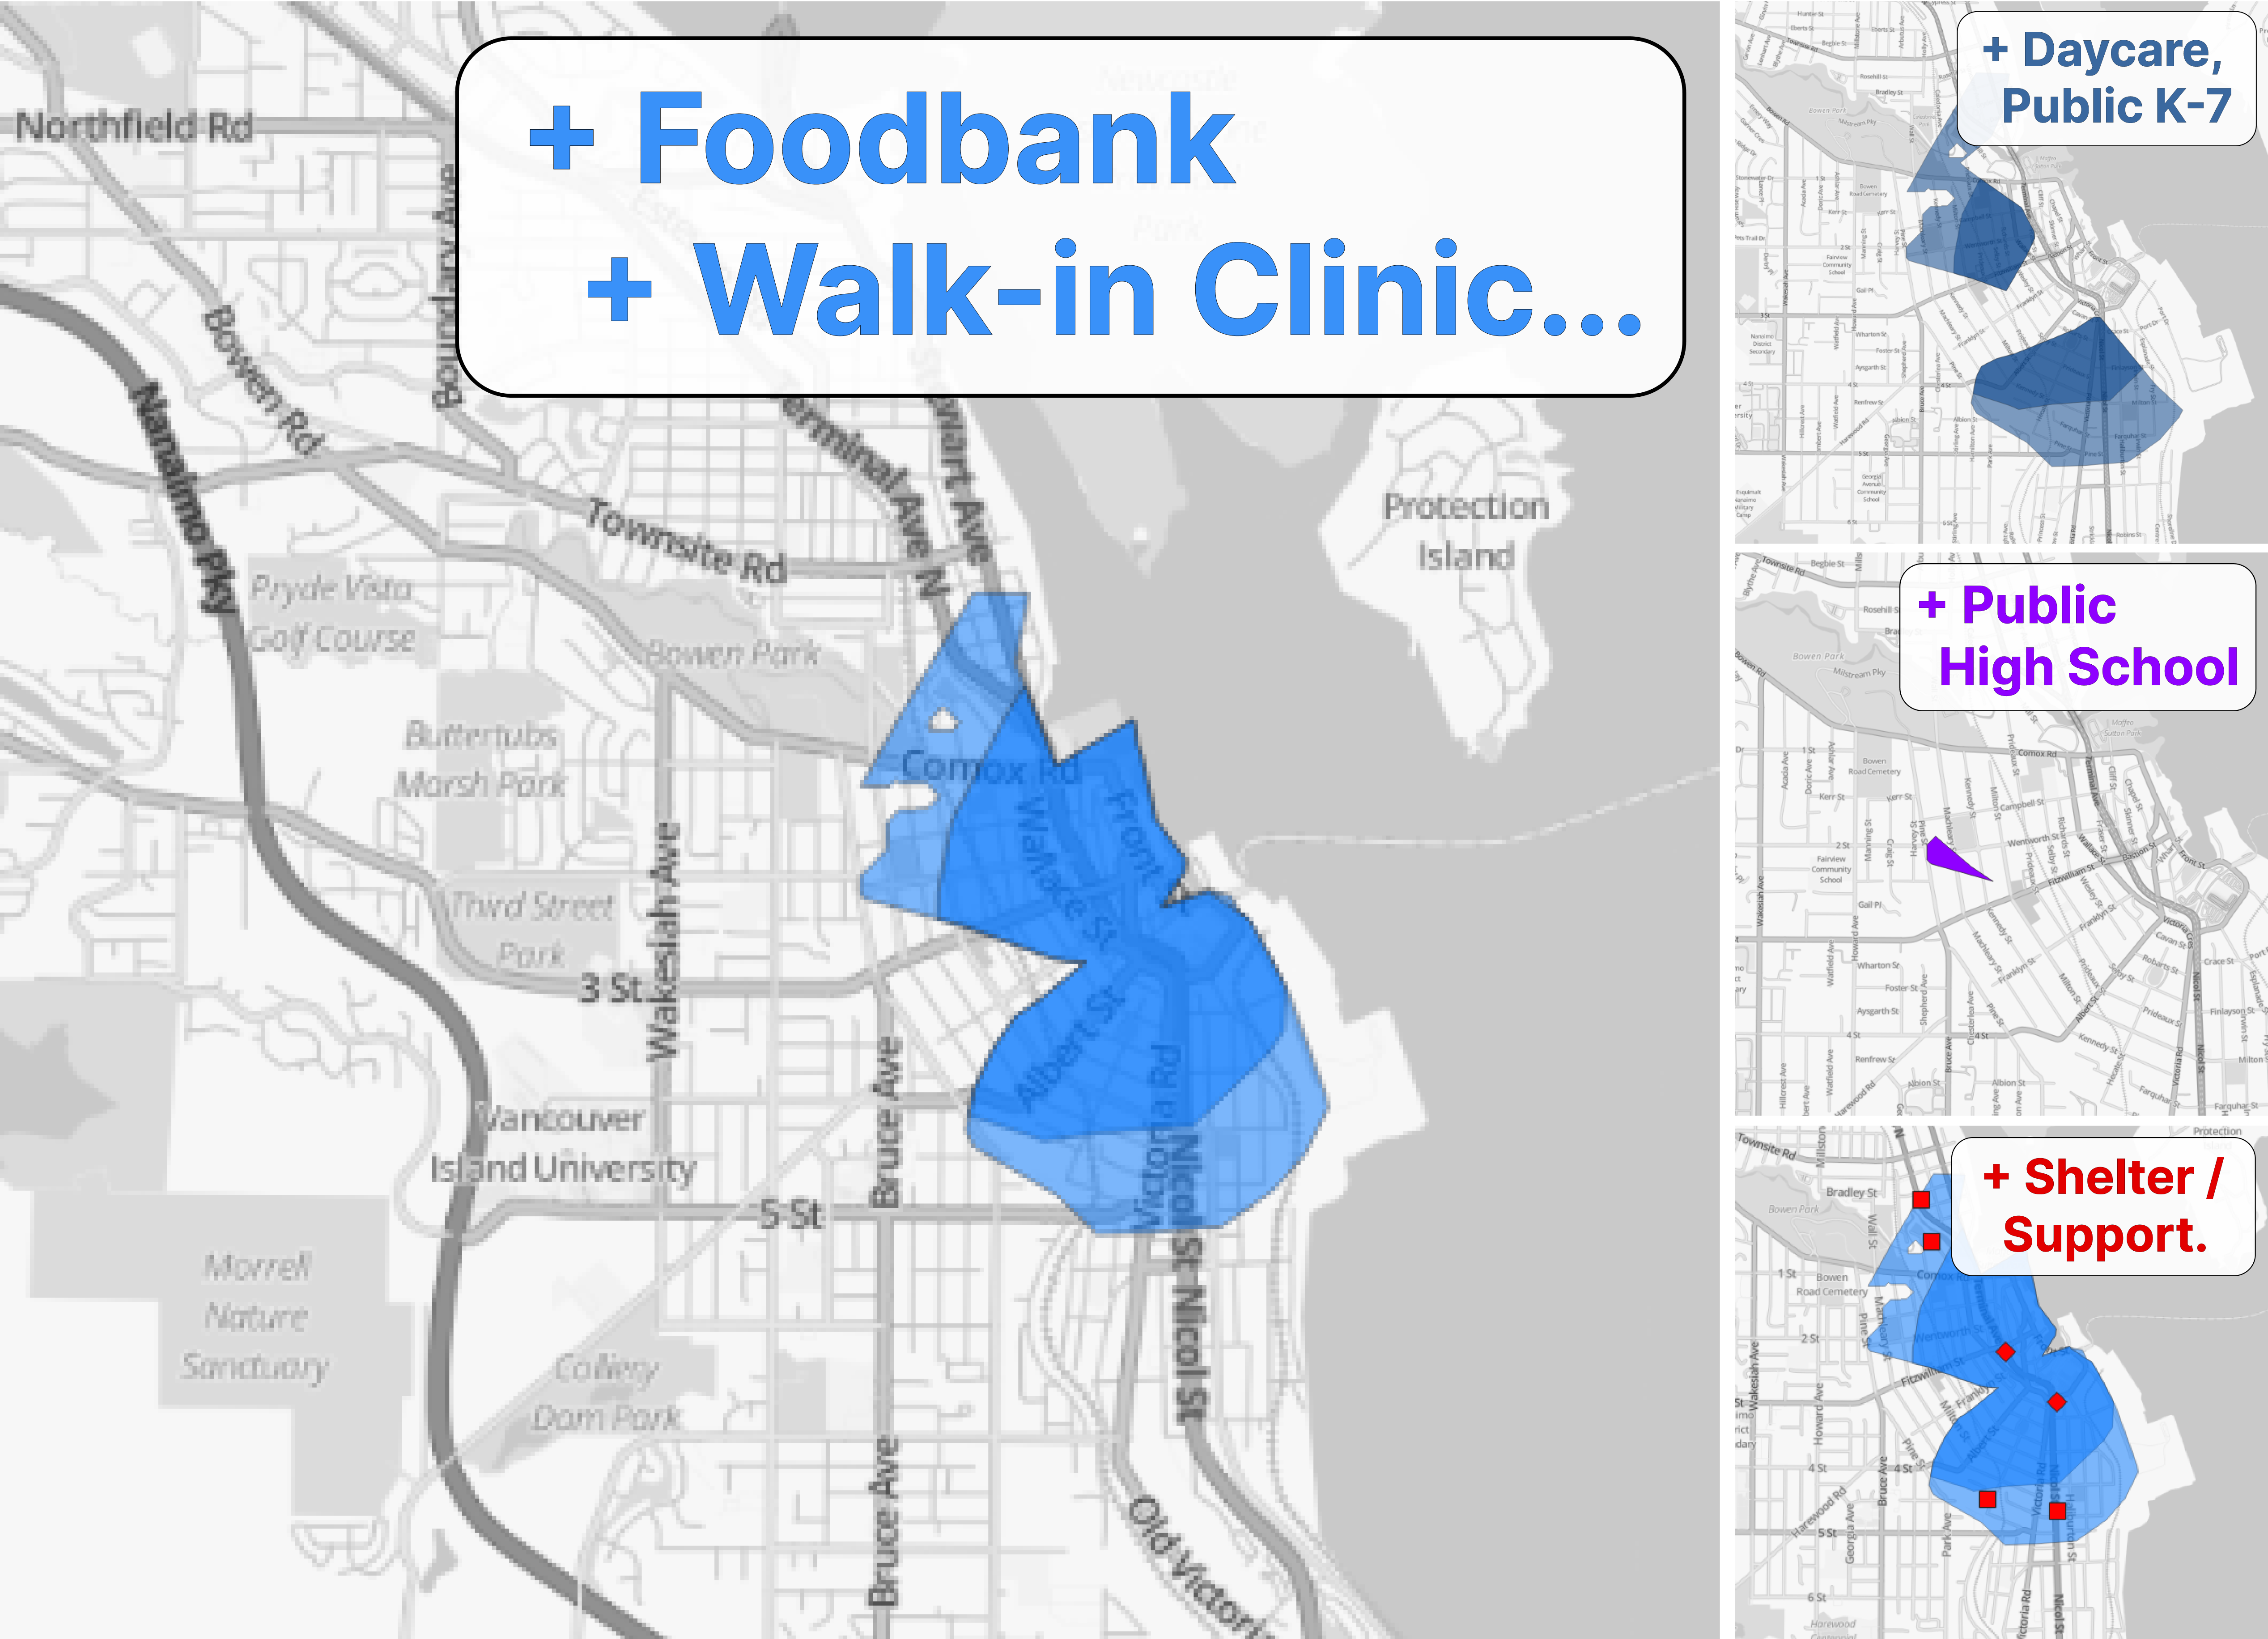
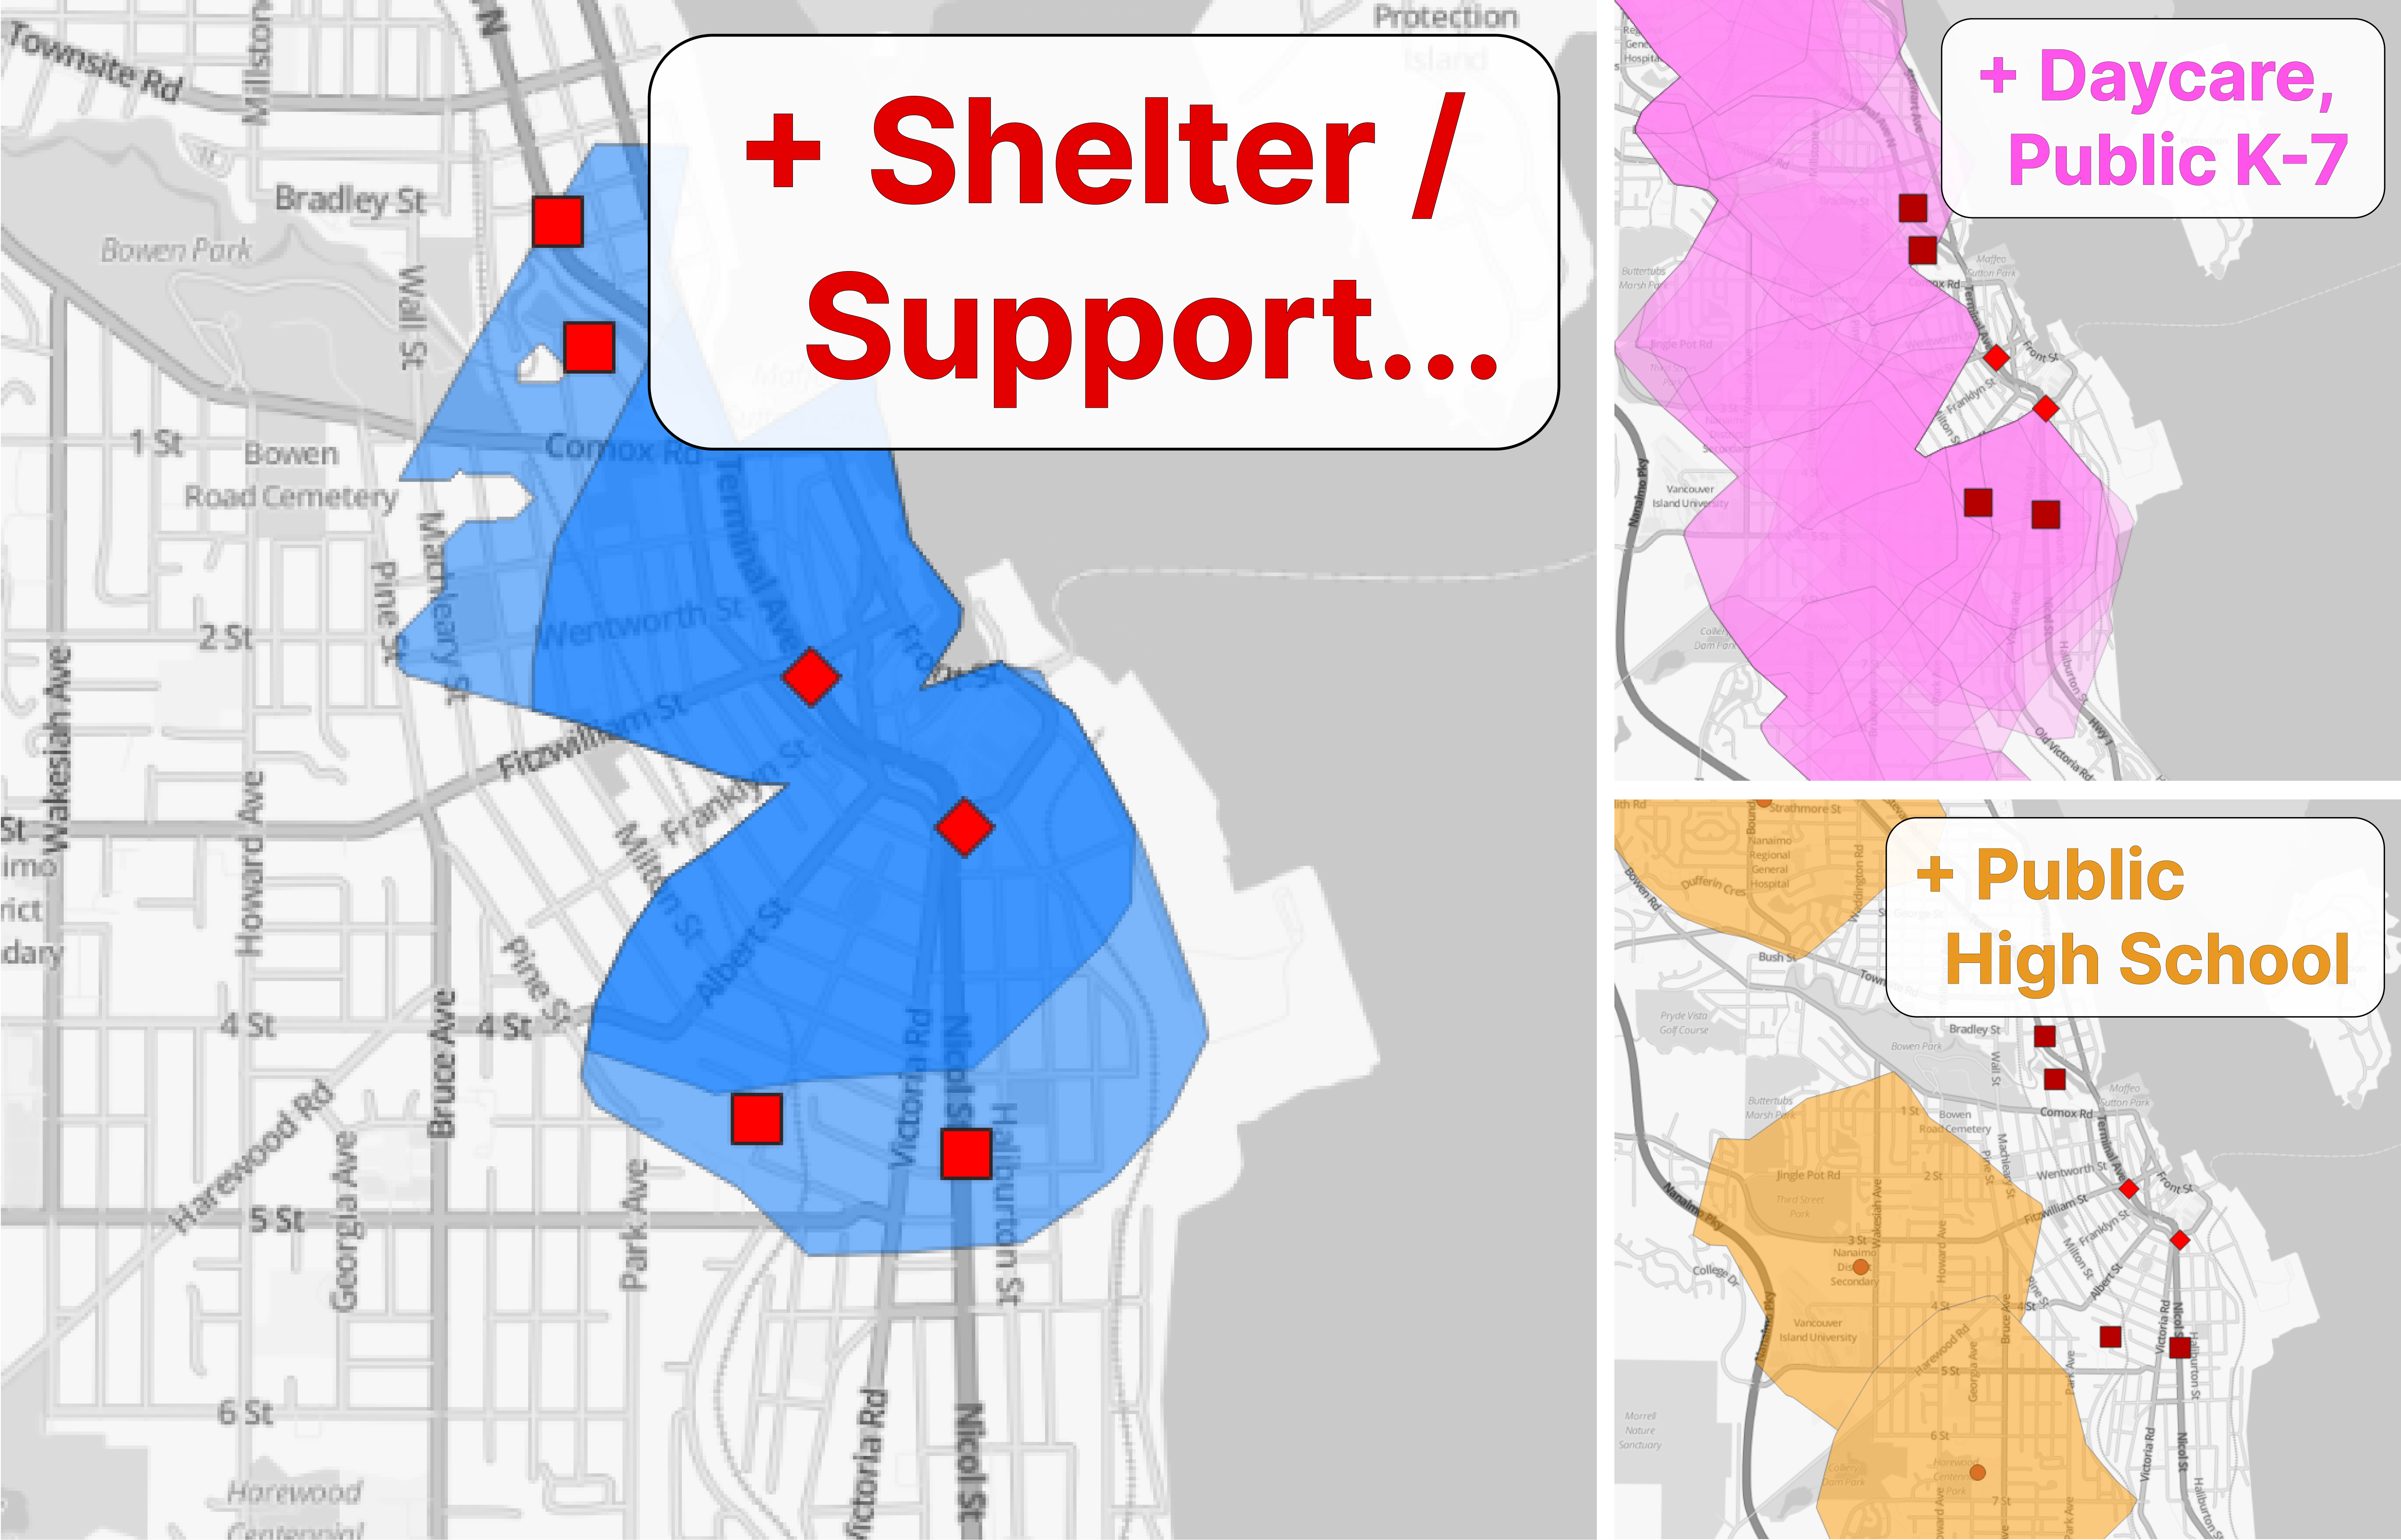
As you can see from these maps your amenity needs increase, the area you can live in and have 15: walking access to everything you need decreases.
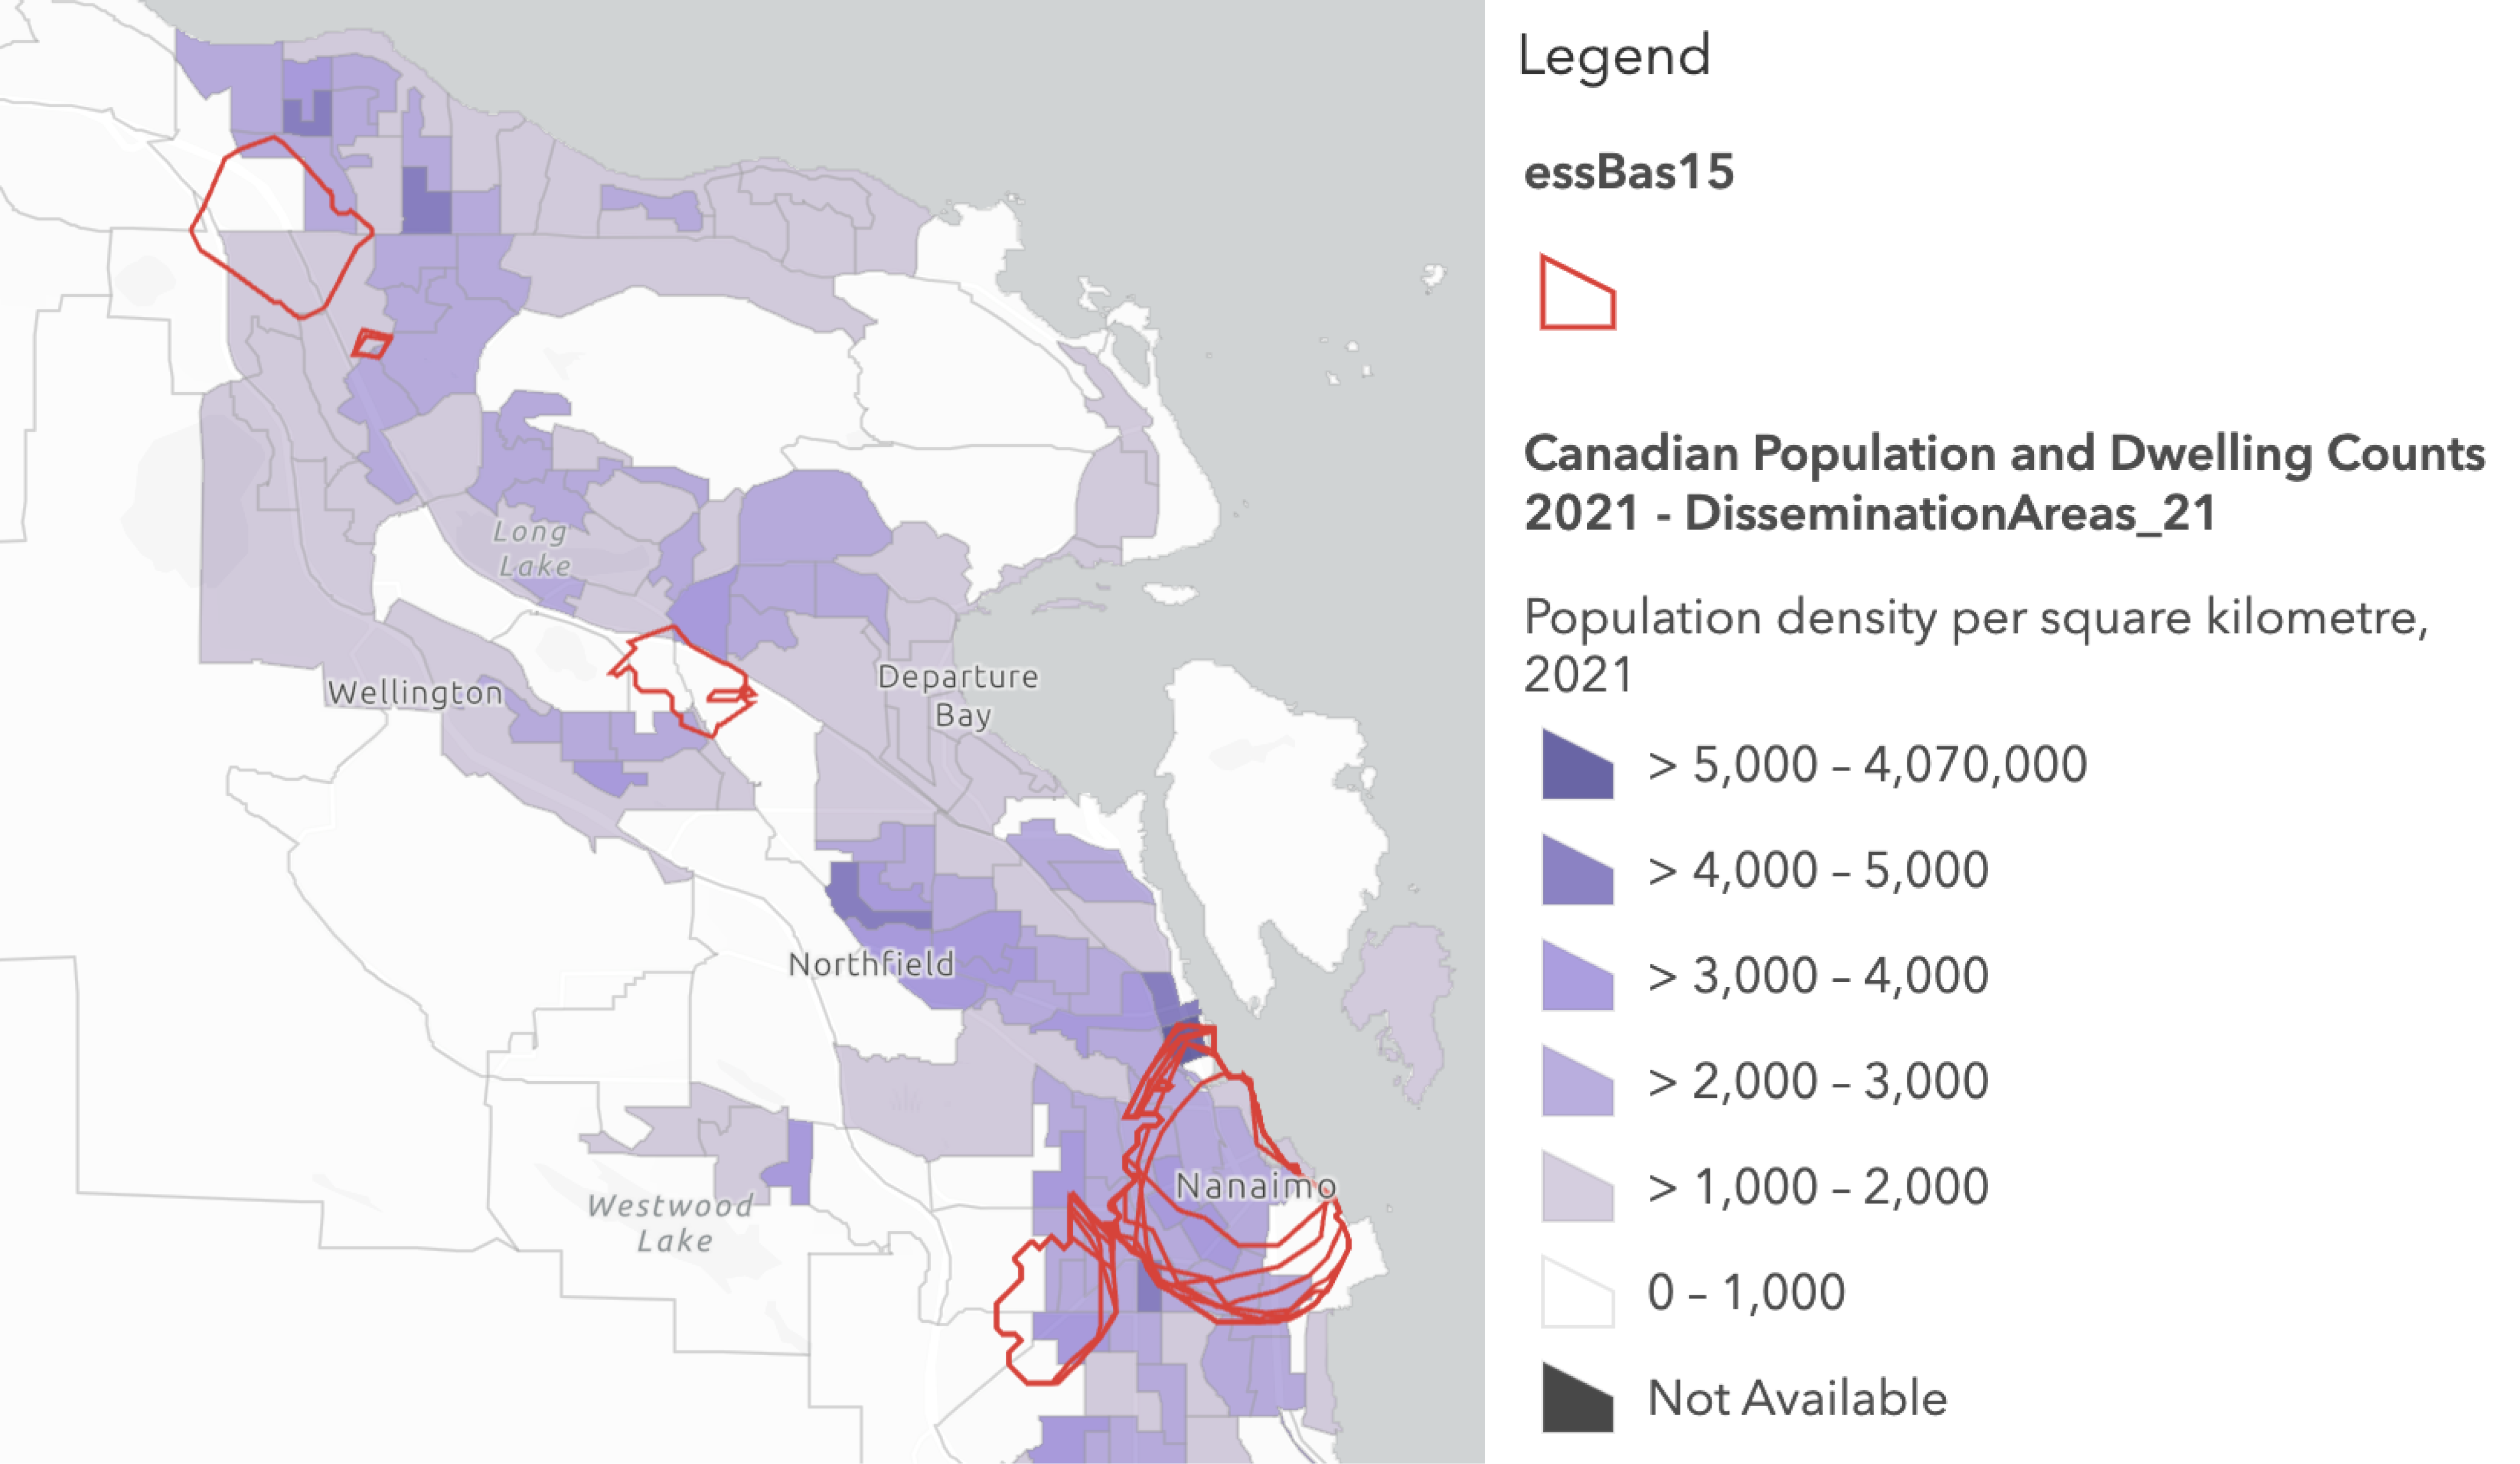
Nanaimo’s 15: Zones
The largest area of 15-minute walkability is downtown and downtown-adjacent. These zones meet the essential and basic quality-of-life amenity needs of more demographic groups than anywhere else in the City of Nanaimo. The other 15: walking access zones are adjacent to the Country Club Mall and Woodgrove Centre Mall, both of which concentrate amenities, but in areas of very low population density. In other words, these areas are 15: zones for far fewer residents than downtown. In fact, Nanaimo’s most densely residential areas (> 5,000/km2, dark purple below) fall mostly outside of all of Nanaimo’s 15: zones, including downtown.
Affordability
So, who can actually afford to live in any of these zones?
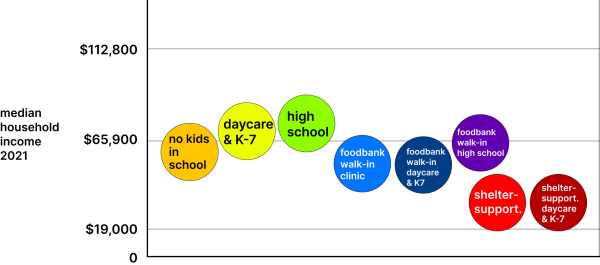
I superimposed my 15-minute walk zones on ESRI’s 2021 Median Household Income map to find out.
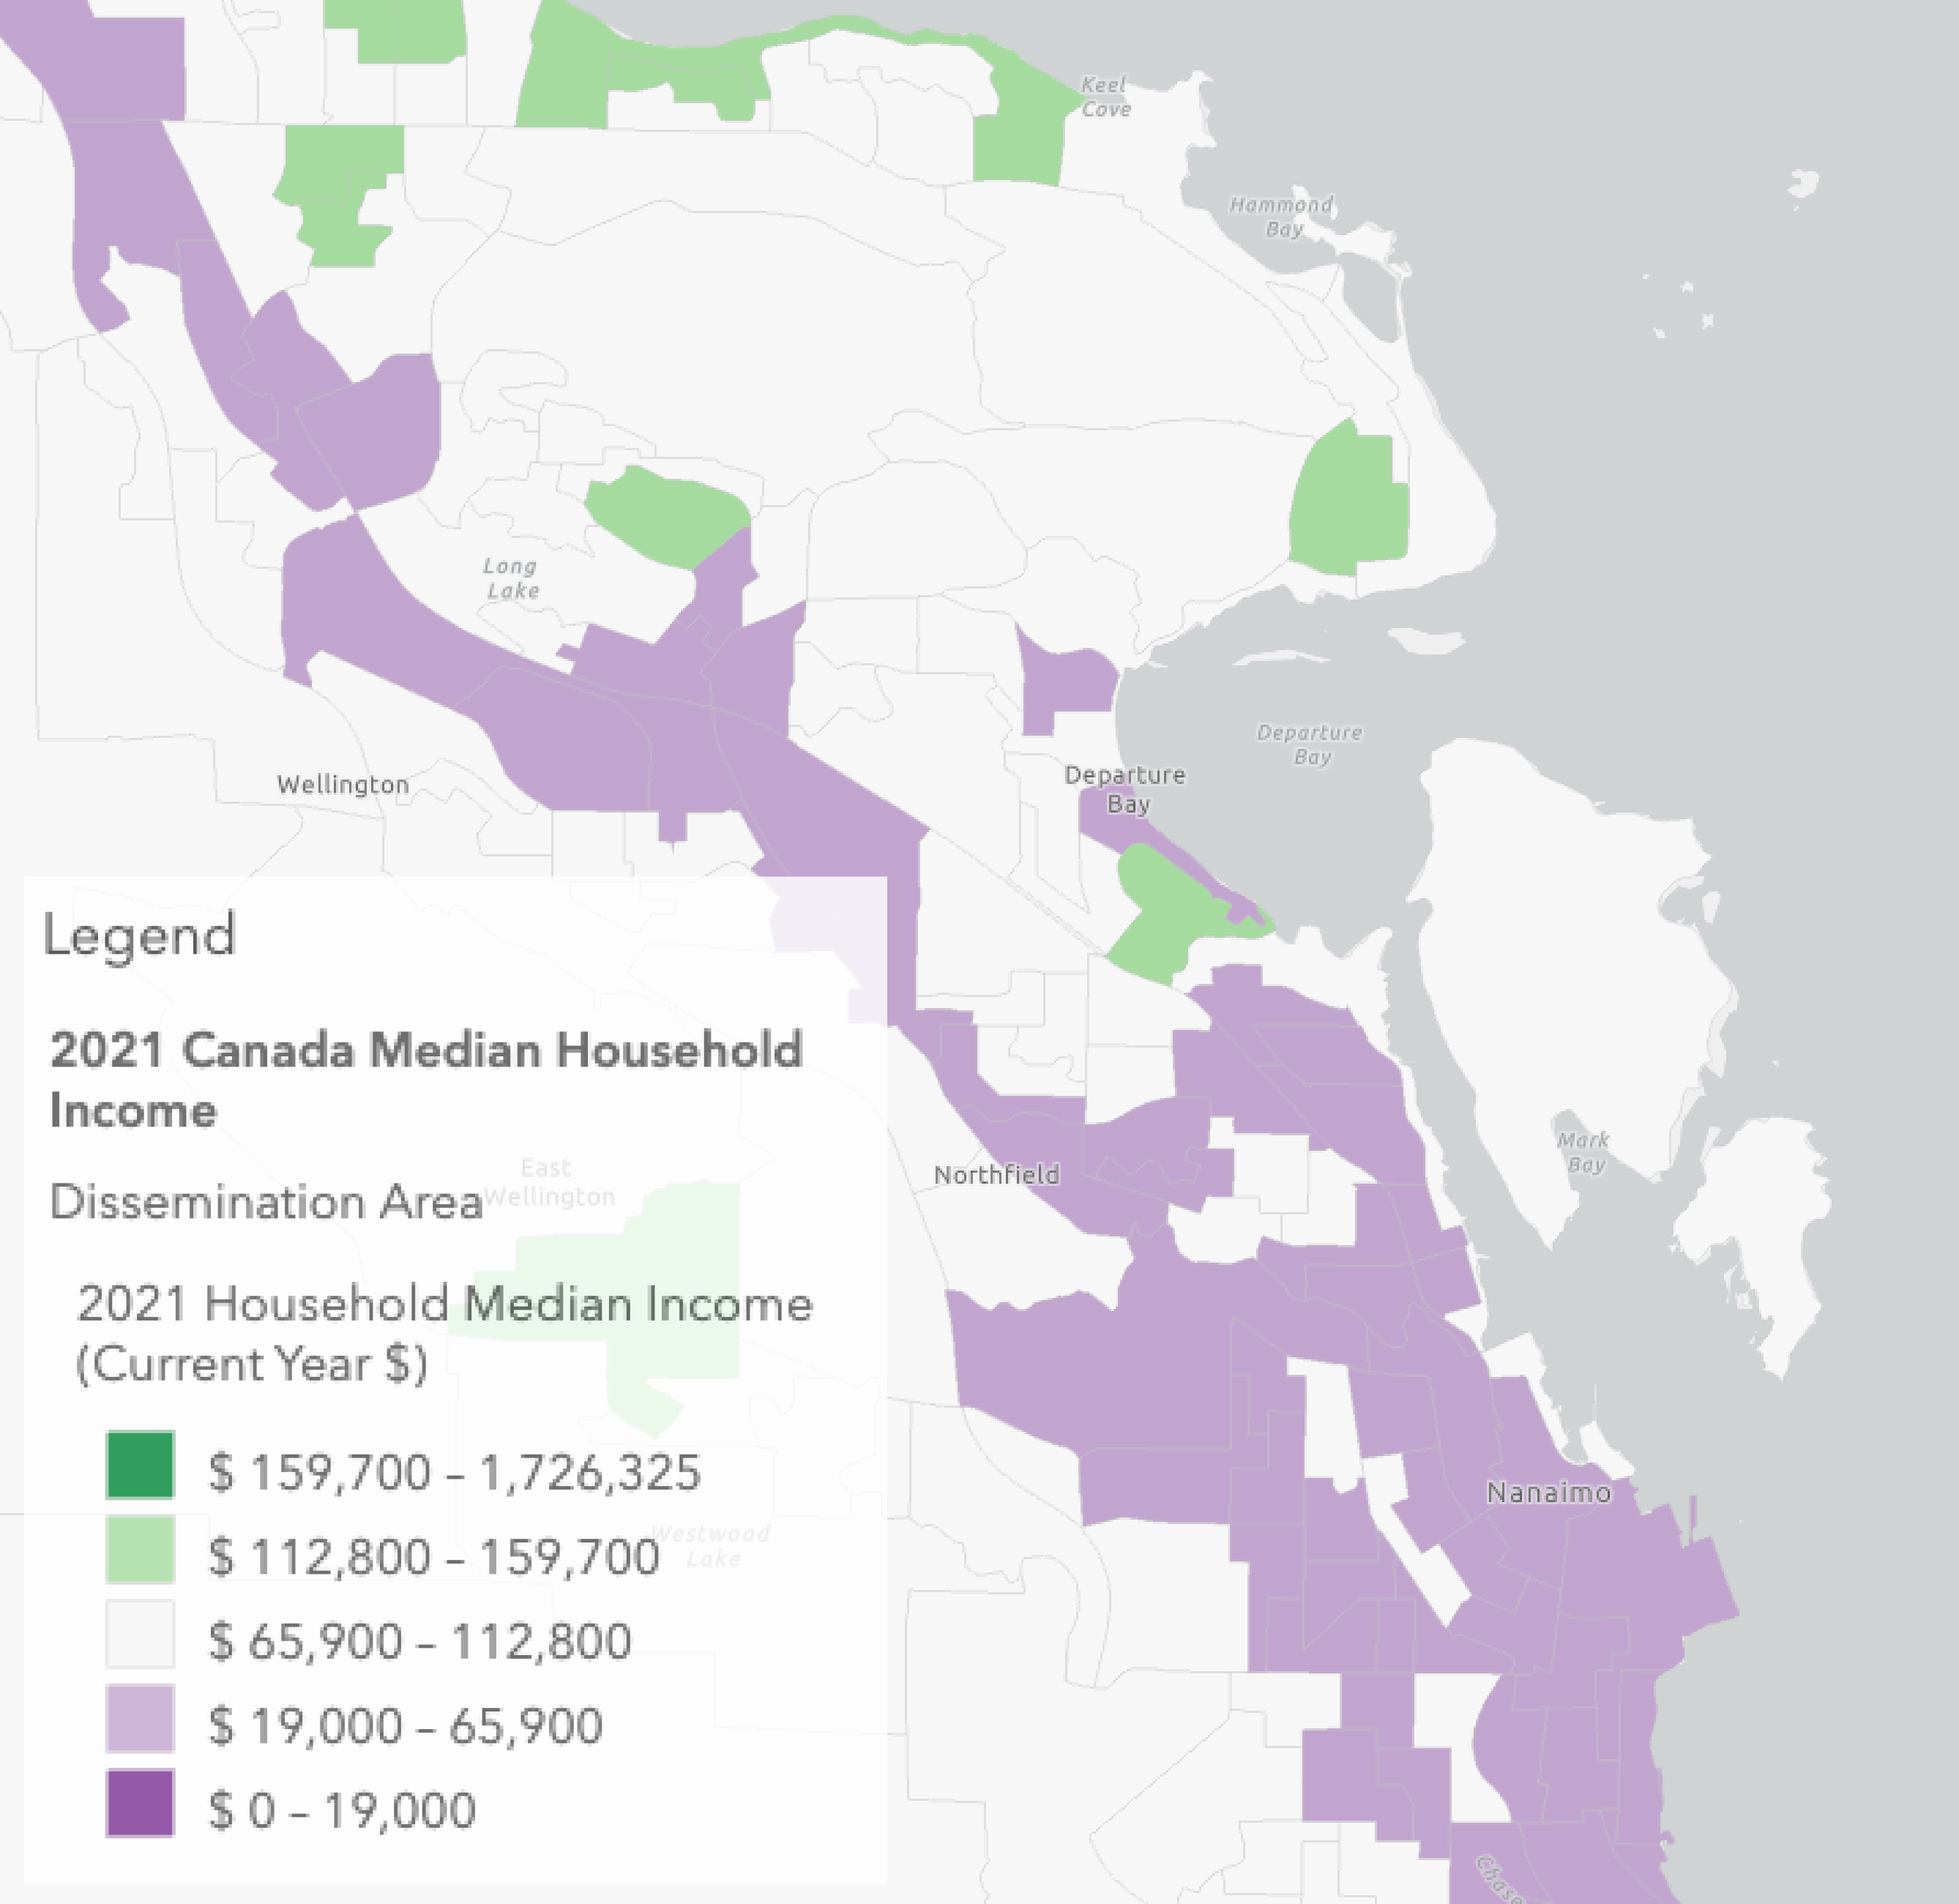
Nanaimo’s 2021 average household spending on shelter ($20,046) qualifies as “affordable” (30% of household income) when household income is $65,900 or above. The further down incomes drop below $65,900 (the highest income in the purple map zone), the more unaffordable (>30% of household income) shelter becomes.
By measuring how much each 15-minute zone overlaps with each median income zone, we can see very roughly what kind of household income each group has to earn to be able to have access to 15-minute walkability.
Depolarize the discussion
The 15: city makes sense intuitively: who doesn’t want their amenities to be close, diverse, dense, and widely available? Low-density development increases infrastructure costs, and residents spend more time and money (driving, in traffic, buying gas, parking) getting to and from the places they need to go. 15: walkability, on the other hand, leaves more time, energy, and money for enjoyment and investment.
Cities that do want to create 15: neighbourhoods should consider zoning to increase residential density near amenities, amenities near residential density, and amenity-residential density in areas lacking both. But as a first step, they should quantify the 15: city as it applies to their own urban space and population so that residents and planners alike can have an informed and depolarized discussion of the kind of urban life they want to create.
Finally, to enjoy 15: walkability, you need to be able to find and afford a place to live. Increasing density and amenity concentration may improve residential availability, but it doesn’t necessarily improve affordability, and may in fact push rents up. Whether and how the 15: city affects gentrification is a topic for another article.
***
Robert Turner is a Technology Lead with a PhD in Government and a passion for public things, including the built environment and urban planning.


6 comments
As someone who has regular contact with people who live in Nanaimo – which really deserves regular attention apart from Vancouver, Victoria and points elsewhere across what we currently call British Columbia – I appreciate this attention to local detail. It gives me a better sense of their context.
Thanks, Dwight. Please share it around if you can!
Welcome analysis for sure. These university towns need closer scrutiny. Urbanized, they have the potential to offer the big metros relief from their growth pressures.
Seems to be a problem with the population density data. Large ares of the city are identified as having a population density of 5,000 people per km² — Here’s Census data from CensusMapper showing the highest population density by Dissemination Area to be about 3000/km² and there’s only two or three of those. https://censusmapper.ca/maps/new#13/49.2054/-123.9922
This link shows density per km² Vancouver, you can scroll across the Strait to Nanaimo.
Census Mapper https://censusmapper.ca/ #CensusMapper
Thanks, Frank, for your comments. If you look closely at the admittedly minor colour hue differences in the Legend (Canadian Population and Dwelling Counts 2021 – DisseminationAreas_21), and then at the map, you’ll see there is only one >5000/km2 population density area on the map right downtown where Nanaimo’s high rise apartments and condos are, and just a few >4000 areas. Not sure what accounts for whatever differences remain between CensusMapper and ArcMap’s ESRI layers.
Thanks for replying Robert. Yes I see that now that I enlarge the image. Overall, as you can see on our large, long and narrow, land mass Nanaimo suffers from very low population density (especially, as your piece points out, in the walkable urban core (where I happen to live)).
Statistics Canada’ Proximity Measures Database identified, in addition to downtown, an area that scored relatively well. The area, in the far north west of the city, on the ground though is entirely unwalkable. “A total urban design failure” I call it in this blog post. https://nanaimocommons.blogspot.com/2020/12/draft.html