
Click here to enlarge the graph.

Fair and affordable housing is a basic right for all New Yorkers and all Americans.
Nydia Velazquez
Nydia Velazquez’s sentiment transcends place and culture. By all accounts, the challenge of affordable housing is one of the most pressing in our age of global urbanization, as its effects ripple across all aspects of city living. Yet, how to achieve this goal remains elusive to planners globally, despite the growing awareness that regulations and urban policy are at least partially to blame for increasing housing prices in many cities around the world.
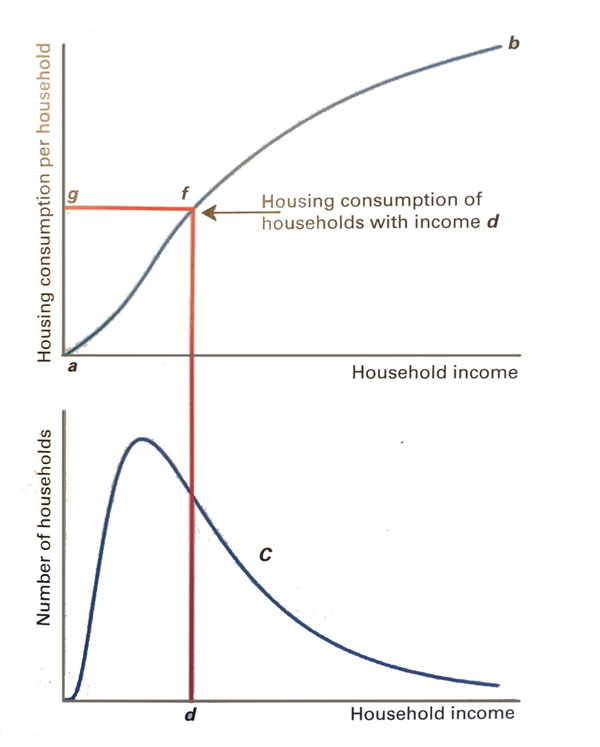
In his excellent 2018 book, Order Without Design, Alain Bertaud—Senior Research Scholar at New York University’s Marron Institute of Urban Management—puts forth a strong method of assessing affordability. It involves analyzing household income distribution data and average floor area per household per income information for a given location. Created as separate graphs and arranged vertically, Bertaud clearly demonstrates how analyzing income-floor consumption relationships—despite being a simplification of reality—is useful in understanding and discussing housing policy options.
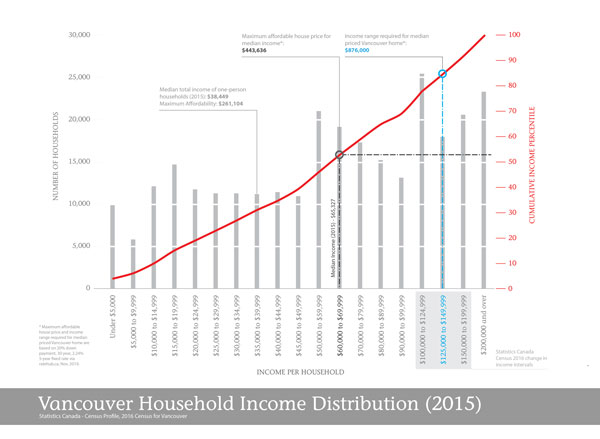
With this in mind—and in light of the City of Vancouver’s on-going city-wide planning process—I have attempted to put Bertaud’s method into practice for Vancouver by creating this Vancouver Household Income Distribution graph. As one can see here, I was sadly only able to collect and visualize Vancouver’s household income distribution, since it was the only publicly accessible data (via Statistics Canada, Vancouver Census Profile, 2016).
Floor consumption levels were nowhere to be found, their closest surrogate being the number of bedrooms or number of rooms, more broadly—through which one had to make various assumptions to glean anything meaningful. This points to a large information gap that requires correcting, if the City truly wants to engage affordability challenges and housing policy. Needless to say, we only see half of the puzzle here. Even with this limited information, however, many meaningful insights can be gained.
As mentioned above, the graph created shows the 2015 distribution of household incomes in Vancouver (the latest census information)—visualizing the different socio-economic groups competing for housing and land. Household income is displayed in mostly equal intervals along the bottom axis. I say “mostly” because, between $100,000-$200,000, the original data changes from $10K intervals to $25K increments. I highlighted this area of change with a grey box accordingly, but it’s worth noting that this makes the visual relationships between the $10K and $25K bars misleading.
Along the vertical axis on the left, we see the number of households within each income interval, while the (red) right axis speaks to the red curve superimposed on the bar chart depicting the cumulative percentage of households within each income interval. So, for example, the population with household incomes above $99,999 account for roughly 30% of Vancouver’s population. This high percentage is directly related to the high cost of housing in the city as, naturally, only households with high-incomes can afford to buy housing.
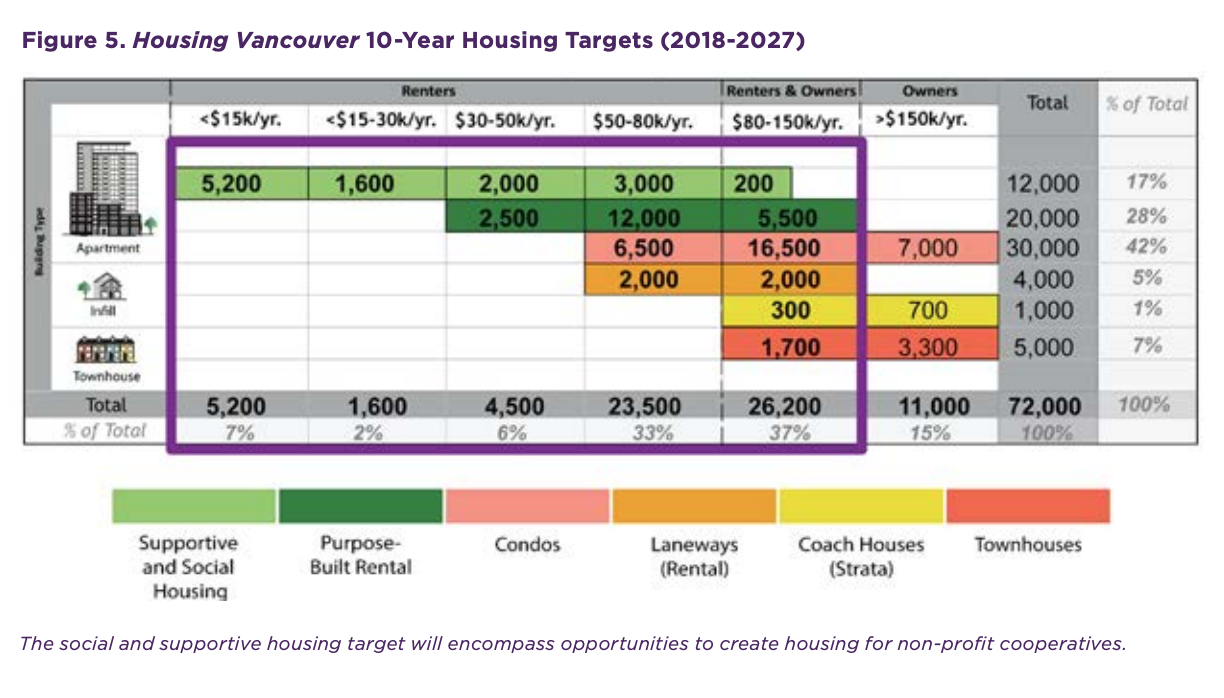
This method of representing different socio-economic groups is much more useful than the coarse grouping often used by municipalities, including Vancouver. Below are two charts taken from Vancouver’s 2017 Housing Strategy that clearly shows how the City divides the population into 5-6 broad categories. This is as imprecise as using ambiguous classifications such as “low-“ and “medium-income”. Finer grain divisions are necessary in order to show meaningful information and ultimately develop solutions.
Back to our improved Housing Distribution graph, we see a number of figures and annotations that highlight the affordability challenge we face. Vancouver’s median income of $65,327 is depicted with the black dashed line. Thus, roughly 50% of the population has an income less than this figure.
Where things become even more interesting are the annotations highlighting the $125K-$150K income range needed to afford the median-priced Vancouver home (blue) and its extreme discrepancy with the maximum cost of $443,636 that a median household can afford to pay for housing (dark gray).
In simple terms, median house prices are only available to 20% of the population with household incomes higher than $125K. The metrics are more dire for median one-person households, who can afford homes at or below about $260K. This is even more concerning when contextualized away from the median to the average cost of Vancouver housing—approximately, $993K.
Taken as a whole, it’s clear that current housing market products produced by developers—and propagated by city regulations—are markedly biased towards 20% of the city’s population, leaving the remaining 80%(!!!) with few, if any, housing options.
There are many nuances to the graph, as well. One worth noting is that the various peaks and valleys across the income distribution point to the challenges facing affordable housing policies put in place to attempt to control the market. More specifically, it points to a complex situation where gentrification can happen across multiple income levels. As such, a multifaceted housing strategy is required to ensure affordability across the city.
To understand why, it is worth going through Bertaud’s example of Shanghai’s income distribution, since it is much simpler than Vancouver’s, as shown below:
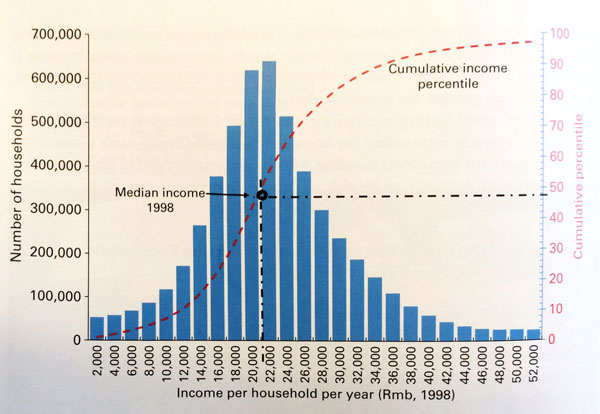
As one can see the income distribution is clustered around the median income of about 22,000 yuan, with a relatively even curve ascending to and descending from this peak. Even within this simple distribution curve, there are challenges.
Speaking to the “trickle-down” affordability theory—a theory that puts forth the idea that when higher income groups move into new housing, lower-income groups are left with the older housing stock that is freed up—Bertaud describes the difference in increasing new affordable housing units by the same amount for populations on each side of the curve.
Those added to the population with an income of 14,000 yuan would greatly improve the affordability for those with incomes below 14,000 yuan, since there are fewer members of these lower levels. Increasing the affordability for those with an income of 36,000 yuan, on the other hand, will have much less impact on those below that income level, since their numbers are much greater than the beneficiaries. In effect, the trickle-down effect would only work perfectly in cases where income distribution across intervals was equal (all bars having equal height), which is a rarity.
Making things more complex, Bertaud argues that gentrification (or “trickle up”) can occur if new housing supplies are focused on supplying lower-income groups while inhibiting supply to higher-income groups—through regulation or otherwise. Devoid of new supply, those with higher-income can outbid and ultimately ‘invade’ the housing stock meant for lower-income groups.
The situation can get more severe when higher-income groups buy existing lower-cost dwellings and assemble them into larger ones, thus decreasing the number of units available overall. This, in fact, is a process that has been making its way through Vancouver neighbourhoods for years, as high-income households buy older housing stock in established areas that were often subdivided into many units and use the entire dwelling as their own. The rapid transformation of Vancouver Specials across the city from two- to one-family dwellings is a clear example and is evident in the decreasing densities of neighbourhoods such as Grandview-Woodland over the past decade. This decrease in housing stock helps to drive costs further out of reach.
The issues highlighted by Shanghai’s income distribution is useful in understanding the challenge facing Vancouver’s municipal officials and planners. Where Shanghai’s distribution had one peak, Vancouver has multiple. This opens up more opportunities for both trickle down and trickle up effects—pointing to the fact that a very strategic, varied approach is necessary to solve our affordability woes. A one-size-fits-all approach just won’t do.
As one can see, much can be gleaned from the limited picture painted by the graph. But this remains a partial view that, in keeping with Bertaud’s method, requires data on average floor area per household per income information to truly lead us in the direction of possible resolutions.
Interestingly, floor area information is largely already collected by most, if not all, municipalities through things such as building permits. Taking a strong sample of standard housing types across different locations across the city, is easily viable and would require a relatively small amount of work to compile and process the data. This could be cross-referenced with market rates—again, data relatively easy to attain—to connect floor areas to the income categories cited above.
Given the extreme state of the affordability crisis, the amount of work involved in gathering the missing information is well worth the effort. And in order to protect the vibrancy, richness, and resilience of what many think is one of the best places to live in the world, there is no time to waste.
***
Related articles:
- Understanding Affordability: A Partial Picture
- Understanding Affordability: A Partial Picture Bertaud’s Response
- Understanding Affordable Housing: The Trickle-Down Theory of Housing – Myths and Realities
**
Erick Villagomez is the Editor-in-Chief at Spacing Vancouver and teaches at UBC’s School of Community and Regional Planning. He is also the author of The Laws of Settlements: 54 Laws Underlying Settlements Across Scale and Culture. His private practice – Metis Design|Build – is an innovative practice dedicated to a collaborative and ecologically responsible approach to the design and construction of places.

