
This post by Beth Savan is part of Spacing‘s partnership with the Toronto Cycling Think and Do Tank at the University of Toronto. Find out more about the think tank, and the series, here.
Two different acquaintances recently remarked that when they returned from a couple of years working outside of Toronto, they were blown away by the increase in the number of cyclists on the roads. Those of us who stayed home during that time feel it viscerally – it’s not unusual to have to circle around the block to find safe bike parking, when a couple of years ago, there were lots of free spots. So what’s happened, and do we really know how much things have changed on our streets?
Although we don’t know exactly who has started to bike in the last few years, we do know just how much things have changed. And they have changed a great deal: Our first hint came when the City of Toronto’s Cycling Study released in 2009 by the city’s Transportation Department showed that 29 percent of Torontonians were utilitarian cyclists. Next, Toronto Centre for Active Transportation and Share the Road released their 2013 survey results, showing that 7 percent of Torontonians cycle daily. Most recently, in September of 2013, Cycle Toronto, working with the Toronto Cycling Think and Do Tank, measured the number of cars and cyclists using College St. at Spadina during afternoon rush hour. What we found was extraordinary: approximately equal numbers of cars and bikes used College at this time on the two study days – though the bikes used only a fraction of the road space, of course. That’s a 74 percent cycling increase on this street in just three years.
Finally, an analysis of the National Household Survey data from 2011 shows astonishing figures for cycling mode share in some census tracts – nearly 20 percent in Seaton Village near Christie Pits and in Dufferin Grove, with other areas of the west end following closely. These figures are for work and school trips only, so the total share of cycling trips might be even higher.
So now we know for certain – Torontonians are getting on their bikes in unprecedented numbers. These increases seem even more significant considering the poor curbside conditions, general lack of separated lanes, meager painted bike routes, and shortage of bike parking, especially back in 2011 and 2012 when most of these data were collected. Way to go, Torontonians – we know that the more of us who cycle, the safer it gets, and so we expect collision rates to be declining and emissions and commercial vacancies to be going down, while fitness, disposable income and business revenues increase.
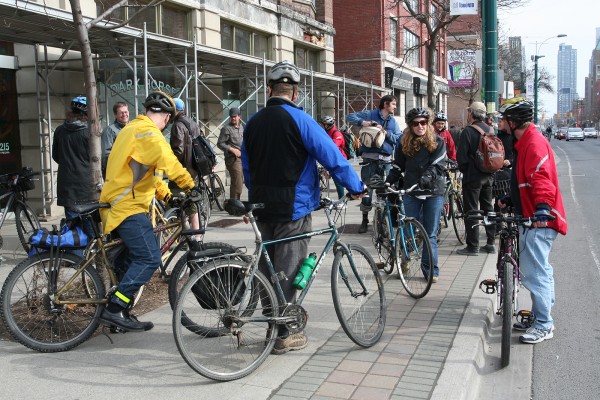
In response to this dramatic growth, we’re finally getting more infrastructure, with the Richmond/Adelaide and Wellesley/Harbord protected lanes. (Although ironically, the bike lane in the picture above has been removed) These improvements are all thanks to individuals, who, one after another, are choosing to cycle.
Beth Savan is the Principal Investigator at Toronto Cycling Think and Do Tank
3 comments
That tiny space next to the white line on Spadina was never a bike lane and never was considered one. They removed the line because people thought it was which put them in dangerous situations.
Narrow the traffic lanes on the suburban arterial roads. It will result in slower, safer horseless carriage speeds. May leave room for bicycle lanes, maybe even separated bicycle lanes.
ie. link to the data that shows the 74% increase. The baseline data plus the new data. It’s just good practice.